
Coronavirus hit markets with unprecedented force in March. Stock prices and bond yields sank. When the outlook grew less dire, markets began moving back in the other direction. As quarantine measures ease, fear surrounding a second wave of COVID-19 is pushing back on the recovery in markets.
Let's quantify the fear using daily COVID-19 case counts in several key states.
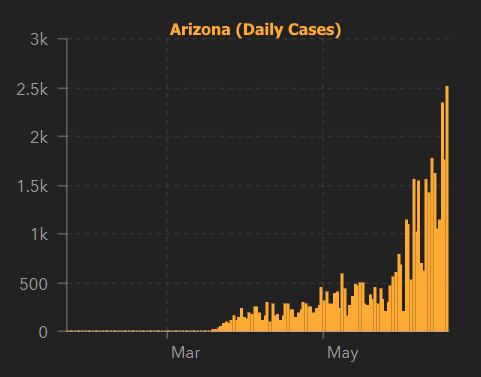
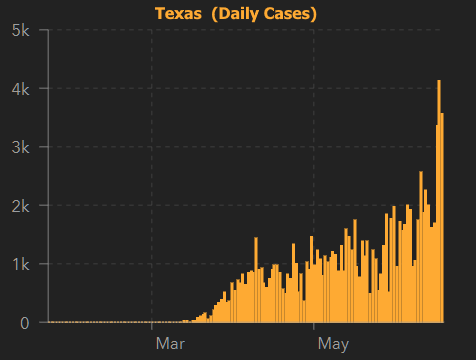
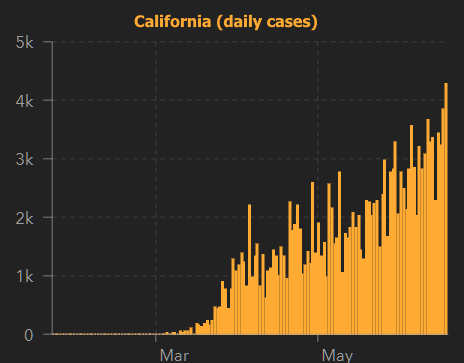
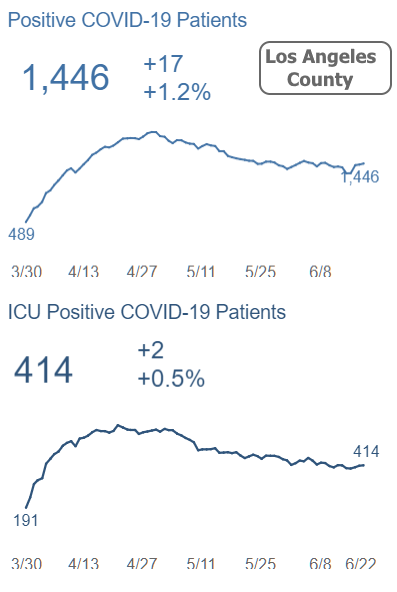
There's no question that these trends are alarming at face value, but the implications can vary quite a bit due to increased testing. We can get a clearer sense of the risks by looking at hospitalization data.
For example, the seemingly dire situation in California looks quite different based on LA County hospitalizations. Numbers remain elevated, but they're not rising nearly as fast as case counts.
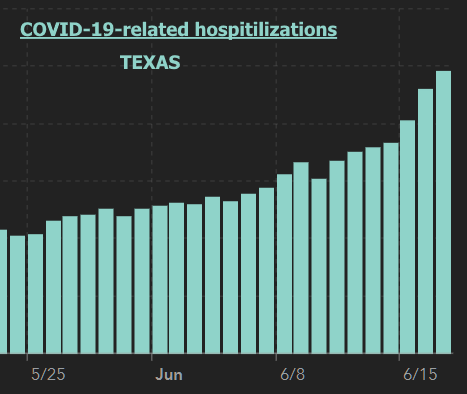
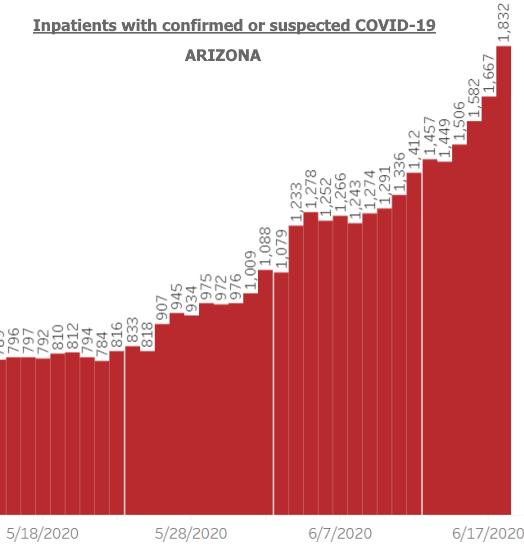
In Texas and Arizona, however, hospitalizations confirm the negative trends.
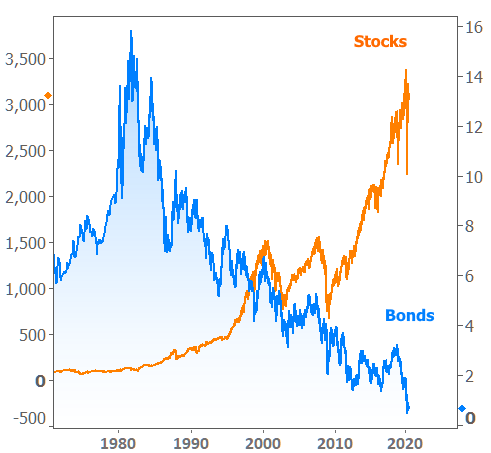
This data raises more questions than it answers, and it's at the heart of why markets are entering a highly uncertain time. Simply put, panic and defensiveness were absolutely the right calls in March. And some level of optimism was clearly warranted after that. In other words, it made sense to see stocks and bond yields tank in March and then move higher.
But now what? After attempting to run higher in early June, both stocks and bonds fell abruptly 2 weeks ago. This coincided with a ramp up in concerns about a second wave of COVID-19 impacts. Are we standing on the brink of a market reversal or merely trying to find the right balance between economic reopenings and public health risk?
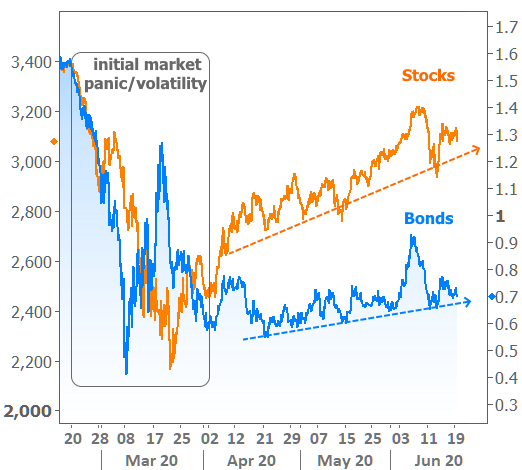
To whatever extent markets trade the "2nd wave" narrative, we could see stocks and bonds try to move below the dotted lines in the chart above. No matter where they go, they're increasingly likely to take cues from each other (i.e. stock prices and bond yields moving in the same direction). This is easiest to see over shorter periods of time.
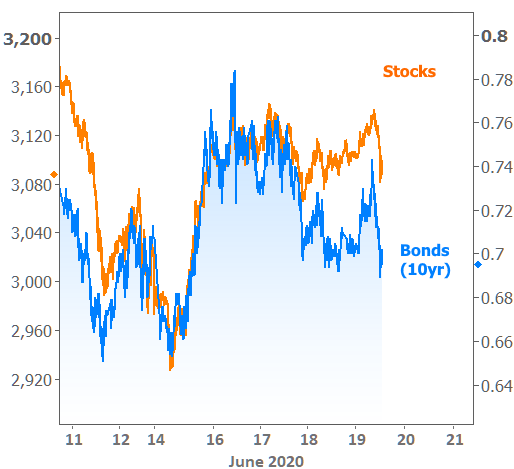
And no reference to stock/bond correlation would be complete without a reminder that one should never expect this relationship to play out in the longer term:
Financial markets are one thing, but how about the housing and mortgage markets? This week brought data on new home construction as well as builder confidence. The numbers speak to optimism about the future while still conveying the ill effects of the present.
Specifically, "Housing Starts" which measure the actual ground-breaking phase of construction, are still noticeably depressed relative to previous levels. Meanwhile, Building Permits bounced back in grand fashion (up 14.4% in May and April's 21% loss was revised to only a 5.7% loss). Neither are back to pre-covid levels, but permits are close.
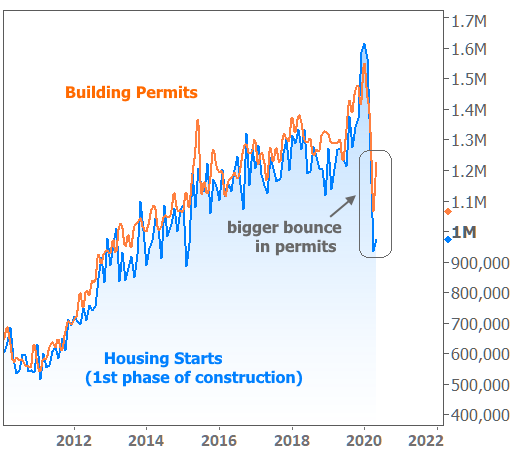
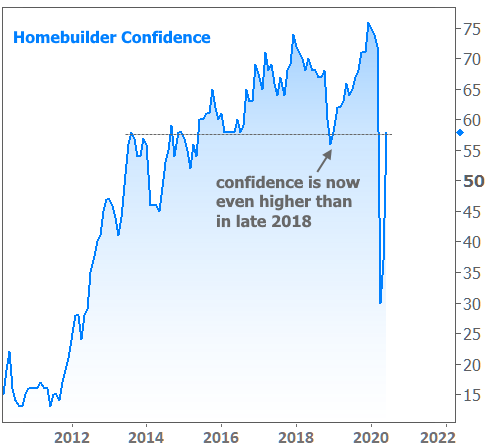
It's no surprise, then, to find that builder confidence soared in the National Association of Home Builder's latest survey. Notably, this survey data was collected well after the Housing Starts data in the chart above. As such, it may suggest a stronger bounce in construction next month.
Are builders participating in reality or is this false hope? If the weekly mortgage application data from the Mortgage Bankers Association is any indication, optimism is justified. Purchase applications were as high as they've been since late 2008!
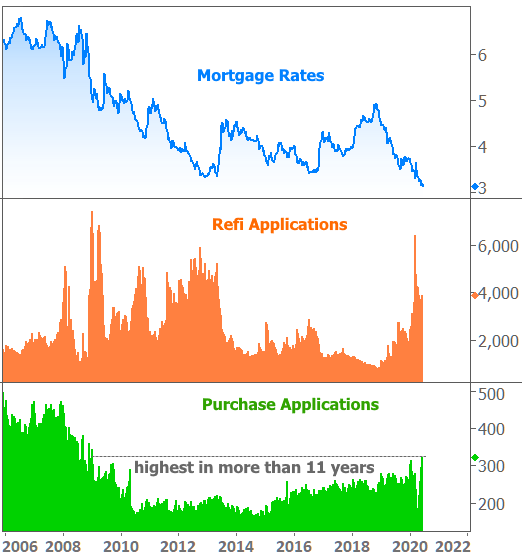
The chart above brings another question into focus: how much of the strength in the housing market is due to mortgage rates holding near all-time lows? Unequivocally, rates are helping housing numbers reach higher than they otherwise would be, but keep in mind, mortgages are much harder to get for certain scenarios right now. Beyond that, the home shopping process has challenges of its own that are keeping some would-be buyers sidelined for a bit longer.
The takeaway is that the bounce back in housing numbers is just like the bounce back in many other sectors of the economy. Things got bad enough that there was simply plenty of room for improvement.
No one is saying "everything's fine now... back to business as usual!" Rather, many things are just quite a bit better than they were--so much so that we're now in a position to debate whether the recovery narrative continues or cools off. That's a debate that will remain open as long as COVID-19 numbers are pushing back on states' lifting of quarantine measures.
