
Rates have enjoyed unprecedented stability near all-time lows following Brexit (UK's vote to leave the EU) in late June. Mortgage rates are still reasonably close to those lows, but other metrics suggest we may have already seen the big bounce.
Whenever we look at mortgage rates, the quintessential "other metric" is the US Treasury market--chiefly, 10yr yields. The term "yield" is interchangeable with "rates," and the 10yr is top dog when it comes to observing trends in
Treasuries tend to move more quickly than the bonds that underlie mortgage rates, especially when global markets are more volatile. If you missed it, I covered this in greater detail in last week's newsletter.
Right now, mortgage rates aren't flashing too much of a warning sign about broader trends. But the same can't necessarily be said for Treasuries. One way we identify warning signs is by looking for "key levels" that have demonstrated some repetitive behavior in the past. This type of analysis works for anything you can put on a chart, by the way!
In the following chart, the key levels surround 1.53% in 10yr yields. You might also run into terms like "pivot" or "inflection point." In all cases, we're looking for places
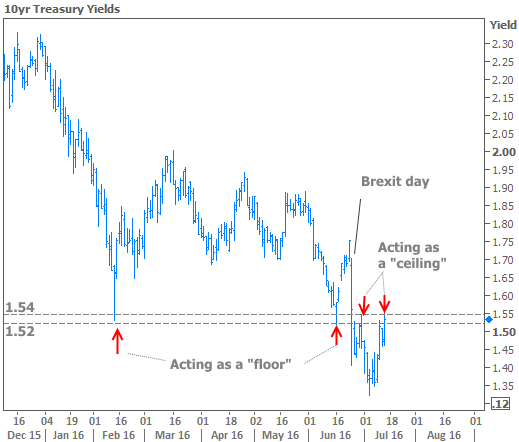
Of course, when it comes to financial markets, repetitions of past patterns won't always predict the future. However, repetition does build a case for a certain level being significant. It's as simple as this: if rates hardly ever break through a given level, it's easier to argue that it means something when they do.
The more repetition we see, the stronger the case for significance becomes. The fact that rates had previously attacked these levels all the way back in February and most recently have treated them as a "ceiling" on several occasions, means investors are increasingly eyeing 1.53%.
We can continue building a case for significance by observing coincident indicators. In the next chart, we see German 10yr yields (a proxy for "European rates"), British currency (
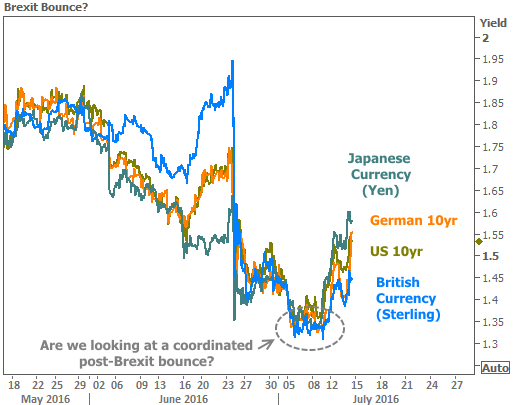
Were this trend to continue, it would be a forceful argument in favor of mortgage rates having seen long-term lows in early July. As of right now, we still haven't seen enough of a move in global financial markets to confirm that big players are running back to the other side of the proverbial playing field--just enough to get the fans on their feet, in anticipation of that possibility.
What does all this mean for you? Not too much at this very moment, but it COULD soon mean that rates will keep heading higher in the short term. To be clear, there is not much belief out there in any dire scenarios for rates in the long-term. But even those calling for rates to hit new all-time lows in the future know there will be periodic corrections along the way. Recent market movements mean risks are elevated that we're on the brink of one of those corrections.
In
In a separate news release, the MBA noted the lingering effects of last week's low rates in the form of another surge in refinance applications. Purchase apps remain troublingly stagnant.
Finally, the MBA released information from its builder survey, resulting in an estimated 0.2 percent decrease in new home sales.
Moving on to other data, foreclosure inventory is back to 1 percent, according to CoreLogic. The firm based this assessment on the fact that only 390k homes (which is 1% of total homes with mortgages) were in some stage of foreclosure in May.
