
Russia's military operations in and around Ukraine over the past 3 weeks have created significant volatility for financial markets. Interest rates were already in the throes of a major adjustment due to changes in the Fed policy outlook. Geopolitical risk has been pushing back in the other direction, creating big swings in a broader sideways range.
The following chart shows how the bond market reacted to this week's geopolitical developments. 10yr Treasury yields serve as a good proxy for momentum in other longer-term rates (like mortgages).

It's notable that the full invasion of Ukraine failed to create more demand for bonds than the initial "peacekeeping" invasion into separatist regions. It's even more notable that yields moved generally higher after the full invasion despite Russian forces ostensibly attempting to take the capital.
Why is that notable?
If you'd asked market pundits what Russia/Ukraine war would do to bonds several weeks ago, few would have guessed that 10yr yields would still be near 2.00%. Fewer still would guess that yields would rise steadily for 2 days during the height of the invasion.
So why have yields risen at the end of the week?
Simply put, the 1.84% levels seen early Thursday morning spoke to brief uncertainty about the scope of global involvement. Rather than expound on the nature of that risk in words, we can simply consider that the spike in the following chart coincides with the "full invasion" spike in the previous chart.
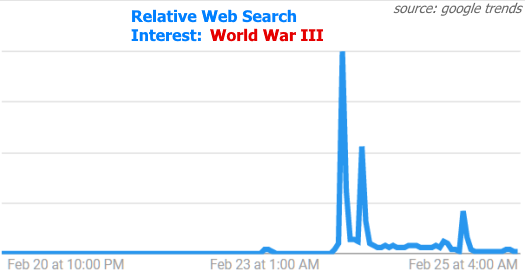
In short, there were a few hours between Wednesday night and Thursday morning where really bad things couldn't be definitively ruled out. As the day progressed, risks dissipated and financial markets began moving back in the other direction.

While the situation in Ukraine can continue to cause volatility, the broader focus remains on the Fed's policy shift. But does Ukraine impact the Fed's decision-making process? That's a good enough question that several Fed speakers commented on it over the past 2 days. While they acknowledged the risks of impact to the global economy and inflation, they all stopped short of saying that it could prevent the Fed from proceeding with its game plan to hike rates in March and begin shrinking its balance sheet several months later.
Betting markets (Fed Funds Futures) suggest geopolitical tensions have put an end to the downward spiral seen since the January 26th Fed meeting. This chart makes the Ukraine situation look like a big deal for the Fed's outlook.

But zooming out, we see that the bounce in the chart above is a pretty small rebound in the bigger picture. We also see that the Fed's policy shift narrative began in October 2021 and merely accelerated in 2022. Coming the brink of World War 3 (or at least worrying about that possibility for a few hours) barely made a dent.

Moving from Treasuries and Fed Funds Futures to mortgage rates, the situation is even more anticlimactic. The mortgage market has been underperforming the broader bond market in 2022 because it is losing a big friend in the form of Fed bond buying. Fed rate hike expectations also hurt mortgage-backed bonds more than 10yr Treasury yields due to complex bond market math underpinned by a simple concept: the average mortgage won't last 10 years.
Why does that matter?
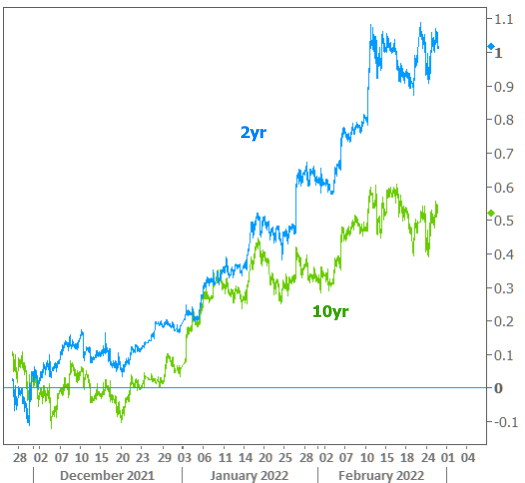
Mortgages are based on bonds and those bonds have a duration--a life span. It varies from loan to loan, but the industry keeps track of the overall average. The higher rates are, the shorter the expected duration.
The Fed Funds Rate has a duration too. It's less than 24 hours. The closer a bond is in duration to 24 hours, to more it will move like Fed rate expectations. As such, the movement in 2yr Treasury yields look like the blue line since December 1st while 10yr yields look like the green line. The 2yr has risen TWICE as much.
All that to say, if we're comparing mortgages against 10yr Treasuries, we're going to be disappointed. Even when comparing against an analytical norm like the 5/10yr Treasury blend, mortgage bonds have been suffering due to their higher reliance on the Fed's bond buying programs.
The following chart shows the relative performance between MBS (the mortgage backed securities that primarily determine mortgage rates) and US Treasuries. The higher the green line, the less mortgage rates can keep pace with Treasury yield improvements.

What's the implication?
Simply put, mortgage rates have moved higher, faster than 10yr Treasuries and they've hesitated to recover because geopolitical drama offers a more direct benefit to Treasuries--the quintessential safe haven investment.
In this week's economic data, the National Association of Realtors released January's Pending Home Sales report, which measures signed purchase contracts as opposed to finalized sales. As such, it's considered to be an advance indicator of Existing Home Sales, and that's generally proven to be the case over time. It also means the pending sales data can be a bit more volatile.
That volatility expressed itself in the form of the biggest month-over-month decline in 11 months. The index dropped by 5.7% to a level of 109.5. Despite the losses, if we look beyond the post-covid sales surge, current levels are still quite strong in the context of the past 15 years.

That's all well and good for the month of January, but where do we go from here? First off, the uniqueness of the present housing and mortgage market situations is a required disclaimer at the top of any discussion of the sales outlook. We've often pointed out that, although rising rates do tend to put downward pressure on sales, they don't singlehandedly derail a strong real estate market.
Unfortunately, rising rates are joined by a still-appalling inventory environment as well as an ongoing price surge that continues to create affordability issues across the country. NAR's chief economist shared the following comments in today's release:
With inventory at an all-time low, buyers are still having a difficult time finding a home. Given the situation in the market – mortgages, home costs and inventory – it would not be surprising to see a retreat in housing demand - Lawrence Yun, NAR
Yun added that geopolitical risks could drive safe haven demand for Treasuries which could put some downward pressure on mortgage rates. Anything's possible, but it's important to bear in mind what we just learned about how the typical correlation between Treasury yields and mortgage rates is basically out the window lately. Even if the connection were behaving normally, the fact remains that geopolitical risk has, thus far, done relatively little compared to the broader Fed policy narrative.
Bottom line, we wouldn't count on geopolitical drama to translate to a significant drop in mortgage rates. That doesn't mean a significant drop couldn't happen--merely that it would need to happen for another reason. Such reasons are many months in the future unless something truly catastrophic were to happen (catastrophic enough that even the biggest fans of low rates would prefer to avoid it).
Back to the pending sales impact... The good news is that the market tends to do a very good job of pricing in expectations for future Fed policy changes in advance. A good portion of that process has already taken place. There won't be a huge new spike in rates simply because the Fed does what it said it was going to do in the coming months. If prices cool off a bit, inventory improves, and rates stabilize, there's a high enough level of demand in this marketplace that the home sales outlook might be better than many forecasters expect.
