
The Federal Reserve (aka "The Fed") has a parrot problem, and it's on a crash course with economic reality... maybe.
The Fed sets policies that impact interest rates in an attempt to keep inflation in check without crippling the economy. After arguably leaving rate-friendly policies intact too long in 2021, they scrambled to put the brakes on inflation in 2022 with aggressive rate hikes (higher rates leave less money to buy other "stuff," thus hopefully lower inflation by decreasing demand).
For months on end, almost every Fed speaker has parroted a version of the same few thoughts:
- Inflation is too high
- Rates need to go higher still
- Once rates are as high as they can be, we need to keep them there for as long as we can
- We don't mind doing some economic damage if it means controlling inflation
- We'd rather do damage and beat inflation than protect the economy and risk another inflation spike
- We don't want to repeat the mistakes of the early 80s.
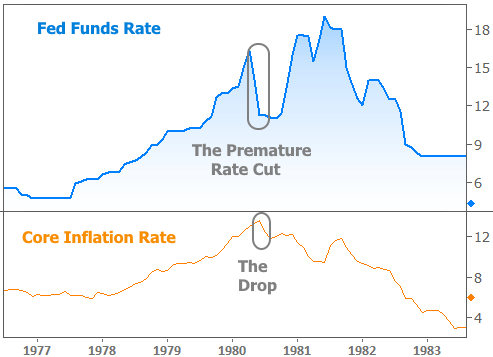
That last bullet point has obviously been a guiding principle for the Fed--repeated by almost every member. It refers to a Fed rate cut in 1980 following a big drop in inflation. Before that, inflation had spike at an unprecedented level and the Fed hiked rates at an unprecedented level to fight it. In short, it looked like they won. They cut rates accordingly, but it proved to be too soon. Monetary scholars think the subsequent rate hikes to the highest levels ever could have been avoided if the Fed didn't declare victory so soon.
Fast forward to the present and the Fed is intent on avoiding those mistakes of the past. The market has generally done a good job of believing the Fed's guidance. Specifically, rates have surged higher, and stocks have languished. But we're starting to see a divergence, and it was highly evident in the responses to this week's various economic reports.
Thursday and Friday were the two most important days. A trifecta of upbeat labor market reports pushed rates higher and stocks lower on Thursday. This is the way the pattern plays out because a friendly Fed helps both stocks and bonds by making it cheaper to borrow money. Cheaper borrowing (aka lower rates) means more economic growth, which is why we often see rates falling and stocks rising when the market is trading Fed expectations.
Thursday's data made markets think the Fed would continue to hike as aggressively as they've promised. Things changed abruptly on Friday. The big monthly jobs report showed strong job growth, but importantly, it also showed slower wage growth. Average hourly earnings came in under the median forecast. Moreover, last month's wage data was revised sharply lower. Taken together, it gives the impression that wage growth has turned a corner.
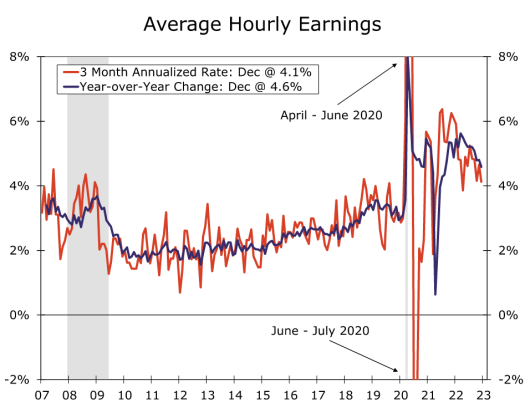
The wage component is/was important news because Fed Chair Powell specifically referenced wage growth concerns in the last press conference in mid December. If wages aren't accelerating, it's one less inflationary concern for the Fed. Markets traded accordingly. Then 90 minutes later, a separate report on the services sector showed massively unexpected weakness. Taken together, the two reports had markets thinking the Fed would end up softening its rate hike stance.
In the chart below, Thursday's data is referred to simply as "ADP" because the ADP employment report was the most relevant market mover that morning. Friday's data is referred to with "NFP" for "non-farm payrolls" (the main component of the big jobs report).

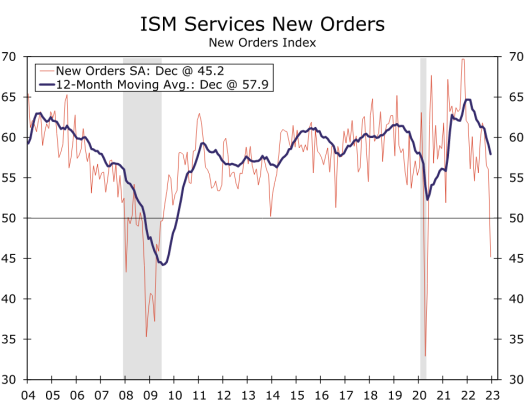
Despite the labels, Friday's biggest movement actually waited until after the services sector data from the Institute for Supply Management (ISM). ISM puts out an index for both manufacturing and services sectors. The latter has been a key focus for the Fed and generally a bigger market mover when it falls far from expectations. This particular report was as far from expectations as any report in more than a decade apart from the first few months of covid lockdowns. The only real counterpoint would be to say that this weakness is some sort of rebound effect after almost 2 years of large annual gains. The chart below shows the headline services index in blue, and the annual change in green.

Another "yeah but" can be seen in the "new orders" component of the index. When the red line dips below 50, it has been a good recession indicator. That may end up being the case this time as well, but Wells Fargo analysts pointed out the moving average remains much higher than during the past two dips. Granted, this could be a process that continues to play out, but the point is that we haven't seen utterly conclusive evidence of recession so far.
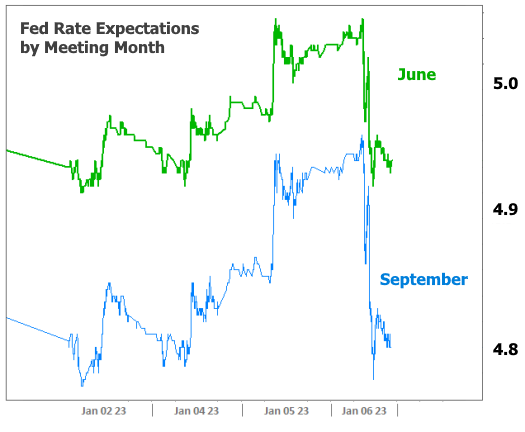
It's that "yeah but" mentality that continues to guide the Fed. Moments after all of this transpired, Atlanta Fed's Bostic said the data did nothing to change his view on the need to continue hiking rates and keeping them at the peak well into 2024. Such views are at odds with financial markets' bets on Fed rate cuts, which are seen happening as early as late 2023.
The following chart not only shows the expectation for September running more than 0.10% below June, but also the immediate and obvious reaction to Friday morning's economic data.
Long story short, the Fed is reading from the same old script where it feels compelled to talk very tough about how it will handle inflation. It justifiably worries that a change in that tone could lead markets to become too exuberant, thus shortchanging some of the work that's already been done to fight inflation. Remember, it's all about tamping down economic growth and demand to buy "stuff." If markets suddenly thought rates were headed precipitously lower, people might start buying enough stuff to keep inflation higher than it should be.
So the Fed will likely continue erring on the side of being a cranky old stick in the mud on rate policy and financial markets will likely continue to nod and smile while continuing to hedge bets with the same sort of logical reactions to data as those seen this week.
As for the mortgage rate response, Friday was the best day in a long time, but the average 30yr fixed rate is still quite high relative to levels earlier this year. In fact, the average lender didn't even quite make it back to the lows from mid December.
