
The market came into the week with a big focus on the scheduled policy announcement from the European Central Bank (ECB). While our focus remains on mortgage rates in an entirely different continent, major goings on in European markets almost always have an effect on the equivalent U.S. markets.
That would prove true on several fronts by the end of the week. In addition to the ECB announcement, markets also reacted to big shifts in European economic data. When domestic data sang a similar tune, rates were moving sharply lower by Friday.
To understand why the ECB or economic data matter to rates, we first need to remember that rates are primarily determined by the trading levels in the bond market. The 10yr Treasury yield, for instance, is a prime example.
Next, we should consider that bonds in the US have an interconnected relationship with overseas bond markets--EU markets being the most notable in terms of correlation. In other words, when something causes a huge move in EU bonds, we tend to see a smaller version of that move in the US.
So what do bonds care about and what makes rates go lower?
Bond yields (aka "rates") move lower as demand for bonds increases. Economic weakness is one reliable way to create more demand for bonds. A weaker economy helps ease demand side inflation pressure (inflation is a key enemy of low rates). It also prompts investors to seek safer havens--investments that won't lose a lot of money if the economy continues to contract--and the bond market is the quintessential safe haven.
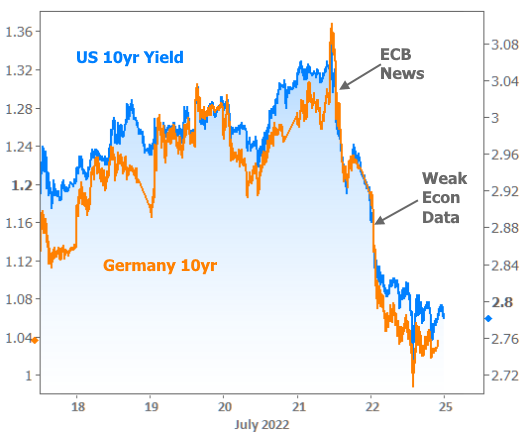
Data aside, big policy changes from central banks--like the Fed or the European Central Bank (ECB)--can have immediate implications for bond demand. In this week's example, the ECB unveiled a new bond-buying tool that promised to add a bit of demand. This pushed European yields lower. US yields followed at a slightly less aggressive pace.
Additional bond buying demand was seen in the wake of several rather downbeat economic reports, with the best examples arriving on Thursday and Friday, both in Europe and the US.
The Philly Fed Index is one of several economic reports that captures relatively broad economic momentum. The headline index (blue line below) turned negative for the first time since the initial covid lockdowns, and the sub-index that measures the 6-month outlook fell to the lowest level in decades.

Another broad economic index is the PMI or Purchasing Managers Index. S&P Global released its PMI data for multiple countries on Friday. France, Germany, The U.S., and the overall Eurozone all saw substantial declines in several key areas. The numbers were not only lower than the previous readings, but well under forecast levels. In the wake of Thursday's ECB news and weak Philly Fed data, this added fuel to the bond buying fire.
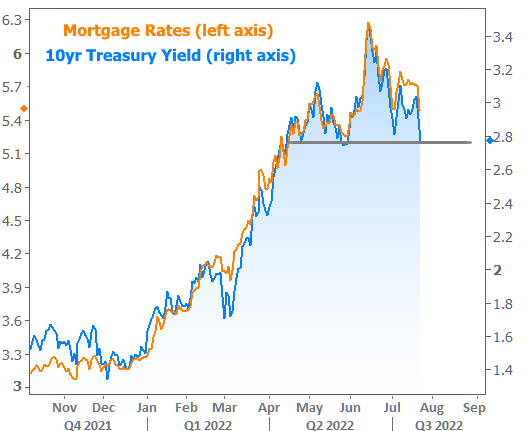
When 10yr Treasury yields are dropping, mortgage rates are typically following, even if the proportion can vary. Mortgages definitely don't benefit as much when it comes to overseas developments, but the sense of a big picture reversal is the same in either case. By Friday afternoon, the average mortgage rate was just a hair lower than those seen in early July. You'd have to go back another month to see anything lower.
Any conversation about big drops in rates requires an asterisk right now. Rate quotes can vary greatly depending on the scenario and the lender, but they're not necessarily as different as they may seem. The reason is the role of "upfront costs" in the current market. Historically, it tends to make more financial sense to avoid paying additional upfront costs (aka "points") in exchange for a lower rate. Many borrowers may still agree.
Nonetheless, points are packing a bigger punch than normal due to trading levels in the bond market, and that is having an impact on many loan quotes. For example, there are some scenarios where a single discount point can drop the rate by more than half a percent. Historically, that point would only be worth 0.25%.
There's no universal recommendation here. If you find yourself comparing one quote to another, just make sure you're taking the upfront costs into consideration.
Other econ data and charts this week (mostly charts)
Not every economic report had a big impact on rates this week, but several of them were still interesting--especially for the housing and mortgage markets.
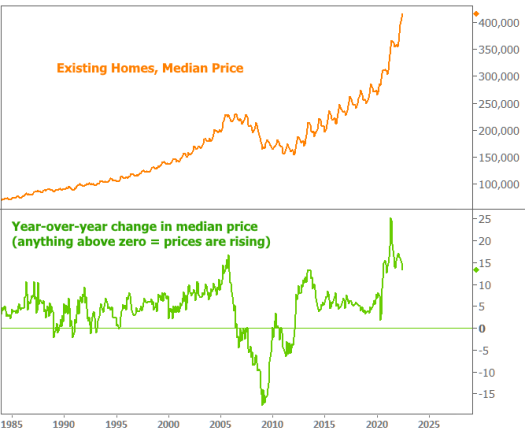
Housing inventory has been a hot topic and although this week's Existing Home Sales report showed inventory remaining low, it is definitely recovering.
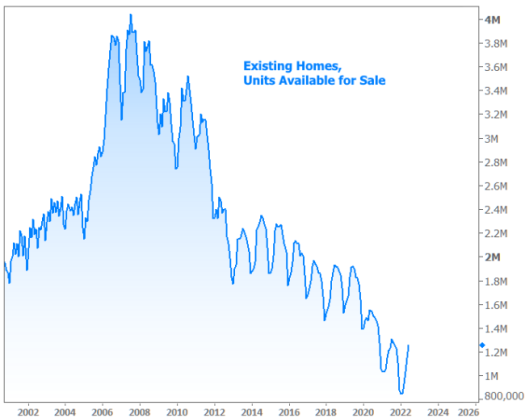
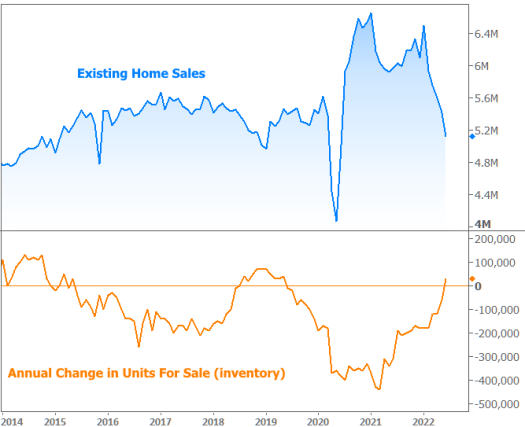
The chart above is not seasonally adjusted, so it's hard to see the shift. The following chart shows the year-over-year change in inventory. It just moved into positive territory for the first time since 2019 thanks in large part to a sharp decline in sales.
Sales may be slowing, but prices are still rising at a historically blistering pace. Note: analysts expect home price appreciation to continue cooling.
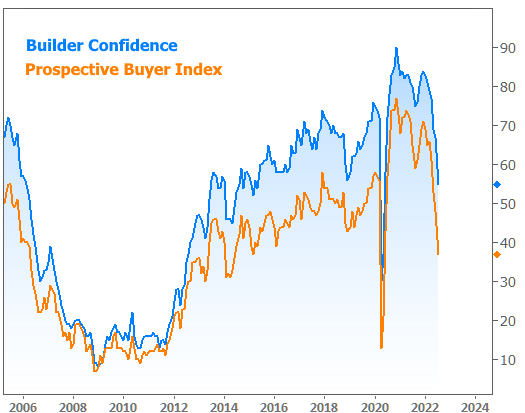
The drop in sales, the recently higher rates, the lack of material/labor, and several other factors have combined to hit builder confidence fairly hard.
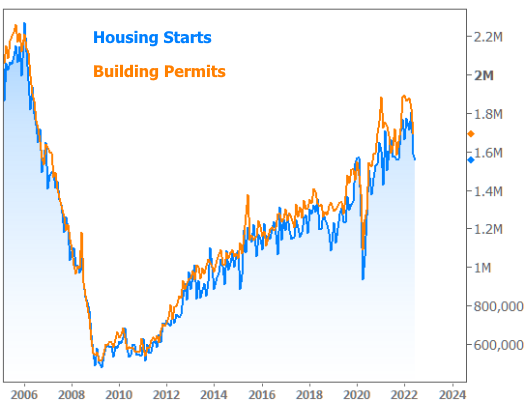
Construction numbers don't paint as bleak of a picture, but they have moved down from their recent highs.
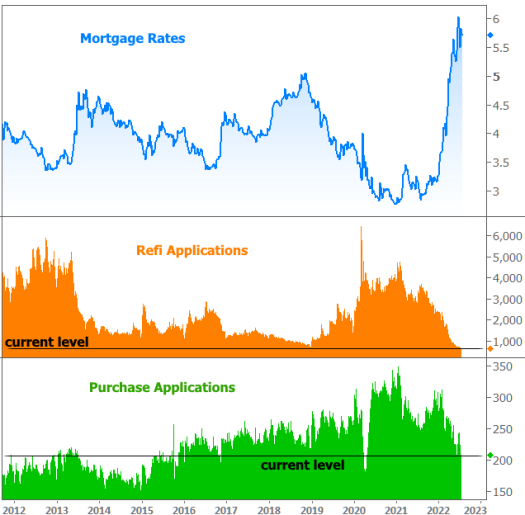
For "bleak," see any of this week's headlines on mortgage applications hitting a 22-year low. Indeed they did, but the week over week changes weren't extreme, by any means.
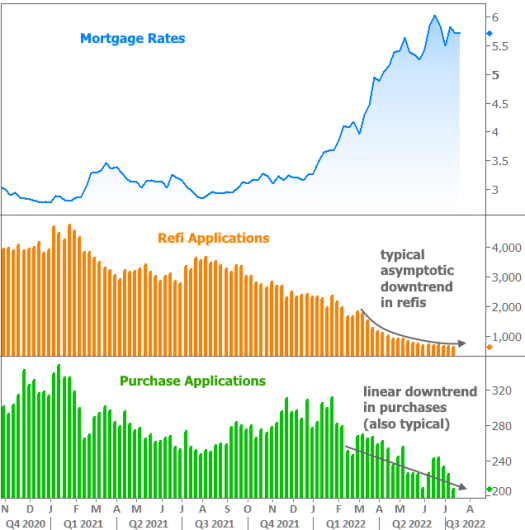
A longer-term chart adds perspective to the current level of applications. Refinance demand is unsurprisingly hanging out near its lowest boundary and purchases have dialed back to 2015-2016 levels.
Looking Ahead
If economic data and central bank communications can create volatility in rates, next week could be just as interesting. We'll get the latest installment of monetary policy from the Fed on Wednesday, and 2 key economic reports after that (GDP on Thursday and PCE inflation on Friday). The combination of these events could cause the recent rate rally to bounce or accelerate, but we would almost certainly need to see a confirmed shift toward lower inflation in order for rates to move significantly lower.