
While there were no further bank failures this week, there was plenty of concern and speculation about who might be next. Those concerns teamed up with Wednesday's Fed announcement to push interest rates lower (yes, even though the Fed hiked rates). Meanwhile, two separate reports showed a decline in home prices.
Bank Failures Driving Markets
Since the failure of Silicon Valley Bank earlier this month, financial markets drastically shifted their trading patterns. Up until that point, the default reaction was for stocks and bonds to win and lose together depending on the implications for Fed policy.
Specifically, if economic data came out that made the market think the Fed would be friendlier, stocks and bonds would improve together (note: an improvement in bonds results in lower yields/rates). If something looked like it would make the Fed cranky, both lost together. It made for an interesting mirror image effect on charts.
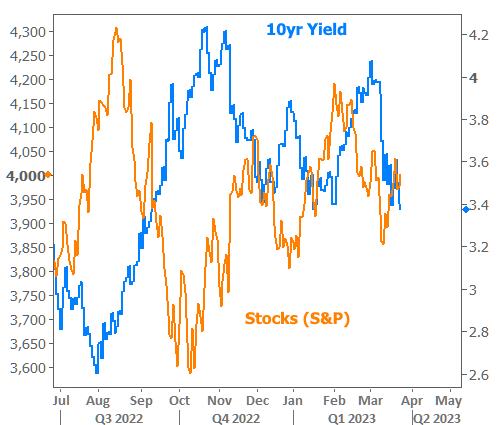
In the chart above, you may notice that the mirror image pattern starts getting less obvious over the past few weeks. If we zoom into a more granular view, we can see that pattern has shifted to one that's more purely correlated--especially this week.
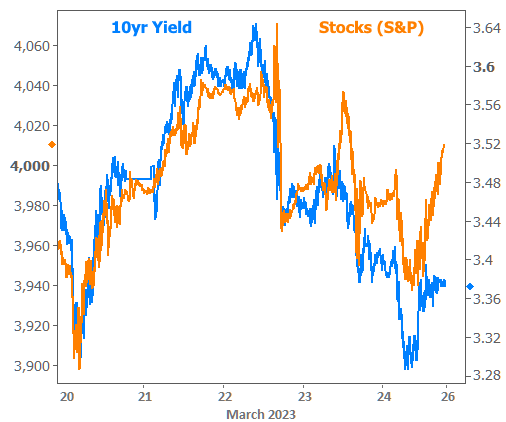
What's up with this? The simple answer is that fears about the banking sector drive what's known as a "flight to safety." This involves the selling of riskier assets like stocks and the purchase of safer havens like bonds. These ebbs and flows have followed the various bank contagion headlines as well as the Fed's comments on that topic on Wednesday the 22nd.
Wednesday's Fed Announcement
The Fed was widely expected to hike rates by 0.25% in spite of the banking drama. As such, the hike itself had little-to-no impact on markets. Instead, traders focused on Fed Chair Powell's willingness to entertain additional risks posed by stress in the banking sector. He likened the uncertainty to a "free rate hike" in that it has the effect of tightening financial conditions without the Fed needing to hike rates again. Many market participants saw this as paving the way for the Fed to be less aggressive with rate hikes going forward.
That said, Fed members can't really change their forecasts to speculate about more bank failures. Markets would read those forecasts as an endorsement of additional panic, thus making rate cuts a self-fulfilling prophecy. Instead, the Fed's outlook for its own policy rate remains around 5% all the way through 2024. Meanwhile, financial markets are already betting on roughly a full point of rate cuts by the end of 2023 (3.9% according to markets vs the current Fed Funds Rate just under 4.9%).
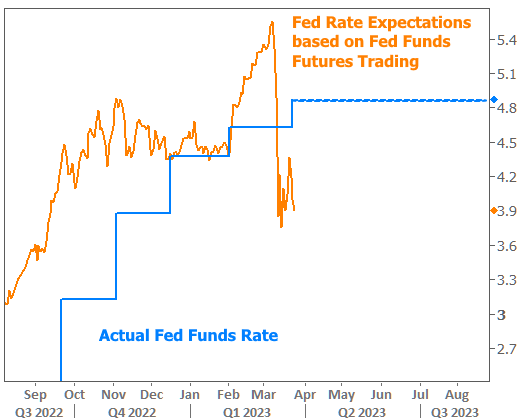
Here's another way to look at the market's view vs the view presented in the Fed's forecasts (also known as the "dot plot" because the Fed publishes said plot in its forecast materials 4 times a year). The red line shows market expectations while the purple line conveys the median view among Fed members.

Mortgage rates tend to track fairly well with 10yr Treasury yields and this week was no exception. Both pushed into their lowest levels since Early February. From here, rates can lurch lower abruptly and infrequently in the event of additional bank failures or significant spikes in contagion fears. Rates can move higher as well, but such a move would likely be more gradual considering traders will only take their guard down slowly as days go by without additional bank failures.
Banking issues aside, there's an economy and inflation to worry about. If banks fade to the background, rates will once again be most readily influenced by inflation and the economic activity that shapes it.
What's Up With Home Prices?
If rates are looking for signs of lower inflation, one might argue they'd see it in the housing market. While this unfortunately isn't the way that housing inflation is measured, two reports on home sales showed an ongoing drop in home price inflation this week. The data made headlines because both New and Existing Home Sales showed prices turning negative in year over year terms.


First off, let's address whether this is just the beginning of another housing crisis or anything remotely like it. No it's not. The most recent spike in prices happened for vastly different reasons and the underlying financial conditions of the mortgage market are infinitely more sound. Perhaps most importantly of all, there simply is not a glut of new or existing home supply as there was back then--a point that we've brought up multiple times in the past few months.
Home prices were badly in need of a correction and this is that correction. It could get a bit deeper or it could stabilize. The details depend on geography and the broader economy. Either way, when we look at a chart of outright prices (the same prices that account for the green line in the chart above), we're left with a slightly different impression:

Did your mind's eye see it? If not, here's the "different impression" implied above:
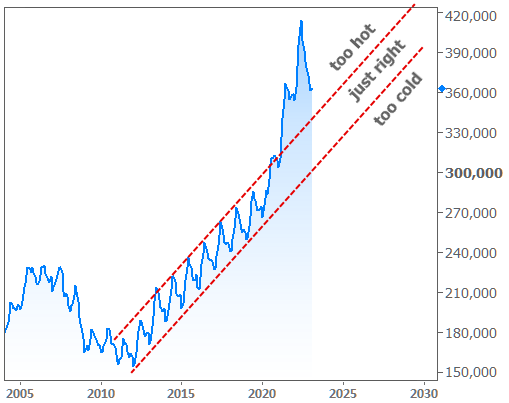
Current prices are still very high relative to the exceptionally stable trend in the decade before covid. Combine that with elevated rates and affordability is a major challenge. That would continue to be the case if prices remain "too high." On the other hand, we wouldn't want prices to quickly swing into "too cold" territory, because that would indicate a problem in housing or the economy, and it could cause prospective buyers to wait for prices to fall farther.
And just in case these charts make you wonder if you should wait for prices to fall, please note that home prices are seasonal and February already moved higher versus January--it just did so at a slower pace than last year.
What's Next?
The banking issues have led the market to shift gears away from a steady trend toward higher rates. The new environment is more neutral as markets wait to see how the banking situation plays out at home and abroad. Traders will also wait for the more relevant economic data in April (primarily the big jobs report and the Consumer Price Index). There are good cases to be made for both camps, but even the Fed can't deny that the case for higher rates looks a lot shakier than it did a few weeks ago.
