
The "taper tantrum" refers to the time frame between May 3rd and July 5th 2013 when financial markets rapidly came to terms with the fact that the Federal Reserve would begin buying fewer and fewer bonds. Those bond purchases were a key motivation behind all-time low rates, so naturally, rates rose abruptly when the purchases were at risk of decreasing.
While the Fed has managed to avoid embarking on a 4th round of quantitative easing (or "QE," a term for large-scale asset purchases by central banks), European QE has been going full tilt since early 2015. In recent months, markets began to suspect the European Central Bank (ECB) might make its own tapering announcement. This week, it pulled the trigger. Will the fallout be the same for rates this time around?
So far, the answer is "no," but the catch is that November saw rates rise nearly as much as they did during the 2013 taper tantrum. If we hadn't seen such an abrupt spike in rates following the election, European tapering might have been a bigger deal.
Even then, the European version of this tapering process has been a different animal than the US version. For starters, don't use the T-word, at least not if you're talking to ECB President Draghi. He sternly reminded reporters that "tapering" was never discussed. Hopefully he can forgive us for using a term synonymous with "a reduction in the pace of asset purchases" to refer to--well--a reduction in the pace of asset purchases.
Semantic delusions aside, there actually is some material difference between the Fed and ECB versions of tapering. The ECB left things more open-ended by simply extending the existing program to Dec 2017 (scheduled to end in March 2017), but reducing the monthly amount from €80 bln to €60 bln. In this scenario, it's easier for markets to hold out hope that there will be additional purchases to follow.
In contrast, the Fed weaned financial markets off the extra cash slowly and steadily, making the 2014 tapering process seem much more final and sustainable. If the ECB had announced a similar tapering process, perhaps markets would believe they fully intended to pull away the proverbial punch bowl. In that case, the effects on rates might have been bigger.
But to go back to a previous point, we've had quite enough "effects on rates" thank you very much! Simply coping with the existing rate spike has been challenging enough for the mortgage and housing markets. In fact, it's amazing to see just how quickly most commentators have changed their tune regarding the long-term outlook for rates. In a nutshell, they're saying that 2016 marked the end of a decades-long interest rate rally and that it's all uphill from here!
While there's certainly a possibility that those commentators are serving pure, genuine Kool-Aid (i.e. maybe they're right), you might not want to drink too much just yet. It looks awfully similar to Kool-Aid that was served at other times during the course of the multi-decade rate rally (circled areas in the following chart).
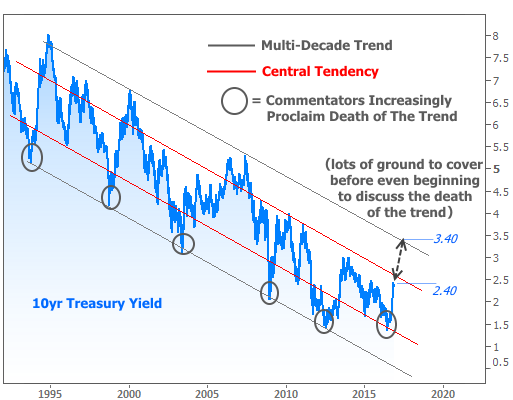
To be fair, there will absolutely come a time when rates no longer perpetually move lower. Indeed, that fact makes it much less risky for commentators to call a bottom in rates now vs 1993, 1998, 2003, 2008, or 2012). The point is that--even if they're right--we haven't seen nearly enough pain to confirm it.
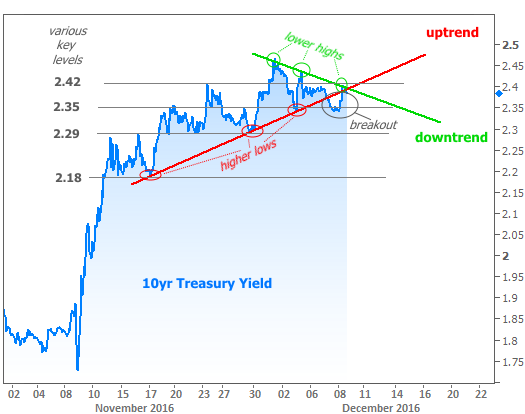
Even if we look at the shorter-term, smaller scale market movements, there is room for some hope amid the recent chaos. Rates are increasingly trying to establish a ceiling after hitting 2-year highs last week.
We can observe these efforts in a chart of 10yr Treasury yields (the benchmark for longer-term rates, like mortgages). The chart shows the competing trends (red and green lines) leading up to this week's ECB news. For now, the downtrend (green line) is winning. From here, we can keep an eye on the "key levels"--especially 2.42%. If yields break above 2.42%, hopes for a ceiling would fade.
Adding some uncertainty to the mix is the fact that the Fed is almost certain to hike rates next Wednesday. While markets agree on the outcome of the Fed meeting, there is much less agreement about the next move in rates. December 2015 serves as timely reminder that longer-term rates can march to their own beat, regardless of a Fed rate hike.
