
There are those who always try to portray the glass as being half full when it comes to the housing market. Then there are those who love a full glass, but who also call it like they see it. Right now, each camp has something to agree on: the glass is more full than it was last month.
Before proceeding, a disclaimer is in order. Outright measurements of housing market health are still not that great. We know that and have been discussing it for the better part of a year as sales slid and rates spiked. That part is old news.
The new news is that there are a few signs of change. If things were to continue to change as they have in the past few weeks, people would really be talking about a bounce in the housing market.
The just-released Pending Home Sales data from the National Association of Realtors is the latest in a small collection of data that quantifies the potential shift. In this case, words are probably worth more than pictures because we can say things like "pending home sales moved up at the fastest pace since October 2021." The chart may be a bit anticlimactic by comparison, but it's a start.
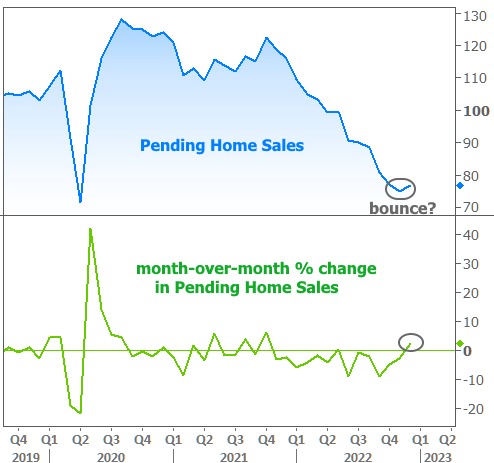
“This recent low point in home sales activity is likely over,” said NAR Chief Economist Lawrence Yun. “Mortgage rates are the dominant factor driving home sales, and recent declines in rates are clearly helping to stabilize the market.”
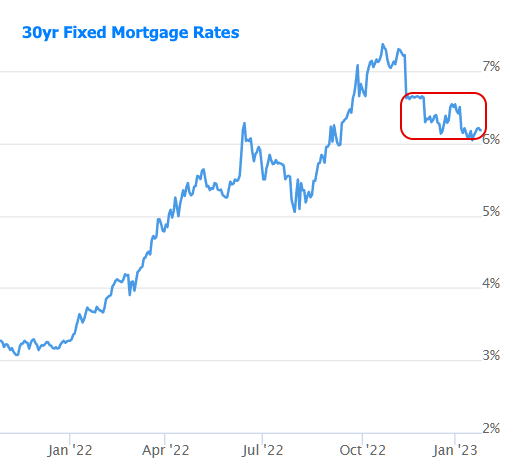
As we've discussed at length in the past few weeks, rates are indeed much improved from 3-4 months ago. But the level of improvement is perhaps not even the most welcome change. Rather, it's the STABILITY. With a range of just over half a percent for more than 3 months, rates haven't seen a narrower, more stable range since late 2021.
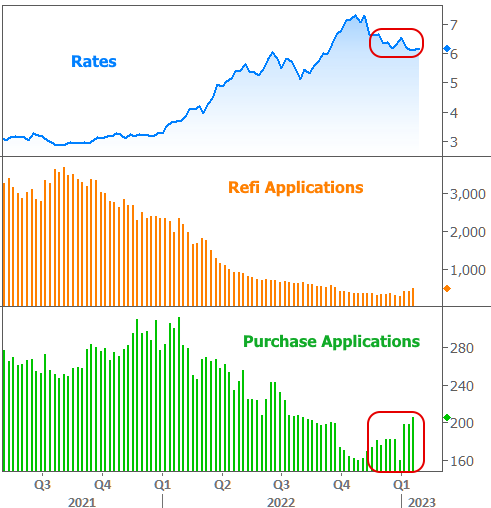
Interestingly enough, this combination of lower and more stable rates PERFECTLY coincides with a noticeable shift in purchase mortgage applications. This week saw purchase apps tick up to the highest levels since August.
One great lesson from the past year (and many other times in the history of market watching) is to not draw sweeping conclusions about the future from a few months of data. Could rates move back up and could housing slump back toward previous levels? Sure. All we're saying is that the housing market will bounce at some point and the inception of such bounces look a lot like the charts above.
A word of caution is in order though. Housing played an outsized role in driving inflation over the past few years. The Fed is aware of it. If the market seems like it's bouncing too quickly, it's entirely possible that the Fed will do or say something to try to keep things on a simmer.
Ultimately, broader economic factors will play the biggest role in determining the trajectory of rates (things like inflation, employment, and measures of economic output). We'll get several big ticket economic reports next week in addition to the latest policy announcement from the Fed. Forecasters and markets have already placed their bets on how that data will look. All we can know is that there is more potential for volatility than there was this week, for better or worse.