
Home sales are very low. Mortgage rates have spiked back to 7%. New mortgage fees have eroded affordability for some. But the news isn't all bad.
We're not going to cherry pick a few favorable data points or signs of resilience. Indeed, incoming news and data for the housing market has been more bad than good for a while and there's no point in pretending that data doesn't exist.
Instead, let's talk about how things look on the horizon. It's pretty simple in this case. The horizon looks incredibly uncertain, but poised for a healthy return to growth.
We can arrive at that conclusion deductively and with examples in the data. For instance, consider the Pending Home Sales data released by the National Association of Realtors earlier this week. It showed a strong rebound impulse in January after holding ground in December.
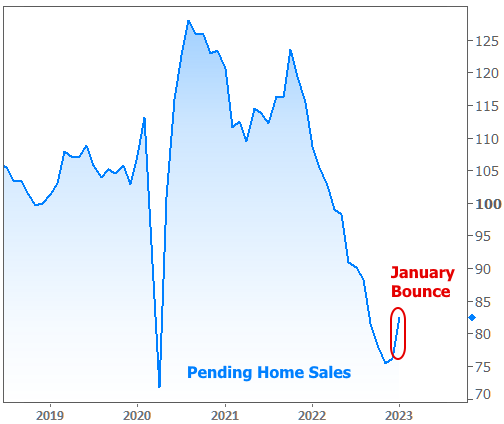
This, along with other economic data earlier in the month, shows the market is ready for signs of resilience. Rates had fallen nicely in Dec and Jan, and those lower rates produced clear results in the economy.
It's the capacity for resilience that is perhaps the best example of news that isn't "bad." If we think back to 2007, these sorts of signs of life on the sidelines were nowhere to be found. It really wasn't until 2010 that the housing market and broader economy finally began to climb out of the gutter.
Part of the prolonged downturn had to do with the very poor health of the housing and mortgage markets, but things were made worse by the absence of near-term economic hope. In the current case, there's none of that past toxicity, and the economy has been showing a remarkable ability to keep chugging along in spite of the fastest Fed rate hikes in decades.
This dovetails into the final reason that it's "not all bad." Whereas we could reasonably expect things to get worse before they got better in 2007, we currently can't really be sure what to expect. In fact, financial markets are very much on the edge of their seats waiting to see if inflation is moderating and if the labor market will finally show signs of a shift.
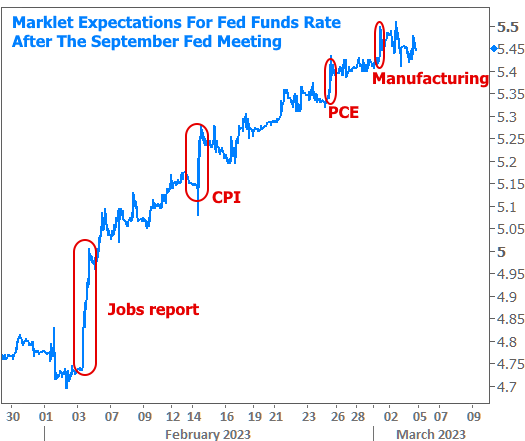
A market on the edge of its seat is eager to respond to incoming economic data. We saw that play out in a way that was bad for rates in February, but the recent hits have been softer and smaller. By the time markets reacting to this week's key manufacturing report, traders weren't interested in betting on the Fed hiking rates any more in 2023. The following chart shows the evolution of the market's expectations for the Fed's ceiling this year.
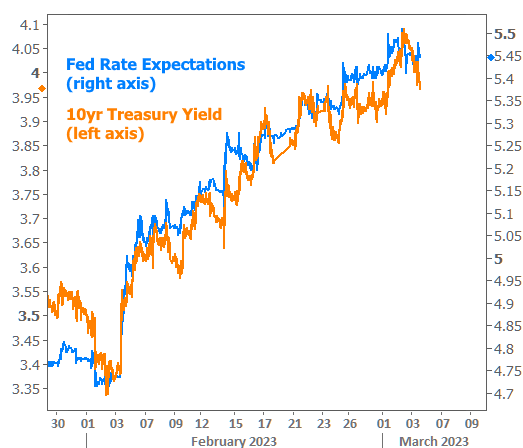
The chart above raises another good point when it comes to keeping a balanced outlook about the future. It is this: by the time the Fed finally hikes rates to 2023's ceiling, financial markets will already have found the ceiling for longer term rates like mortgages and 10yr Treasury yields. Long-term rates don't follow the actual Fed Funds Rate nearly as well as they follow Fed rate expectations. The 10yr Treasury yield gives us a good way to view the correlation in the medium term.
As for why we might care about 10yr Treasury yields from a housing/mortgage perspective, the following chart speaks for itself:

The chart above shows mortgage rates pushing over 7% this week. That number might be higher than most news outlets are reporting. Don't worry, we don't need to accuse anyone of "fake news." There are solid explanations for the discrepancy.
The average news outlet reports Freddie Mac's weekly rate survey. It is actually an average rate from loan applications submitted through Freddie's underwriting system. That means lower rates from last week drag down the average. If you think about it, who cares what rates were last week if you're reading this today? Last week's rates are no longer available and if today's rates are the highest in months, the average over the past week will obviously be lower than reality.
Another distortion in Freddie's survey methodology arises due to the absence of points (upfront costs that help bring the interest rate lower). Freddie no longer reports points, but the loans feeding their calculation still have them in many cases. By the time we adjust for points and the average-induced lag, every media outlet would be roughly on the same page, and that page is very close to 7% right now. Some quotes will be over or under depending on the scenario.
Recently, there has been a big shake-up in the world of lender-imposed upfront fees. Actually, lenders are required to collect these fees, but they're actually imposed by federal regulators. In this case, the FHFA tasked Fannie and Freddie with adjusting what are known as "loan-level price adjustments" or LLPAs. That's fancy jargon for "mortgage costs determined by characteristics of the borrower and the kind of loan they want."
For instance, borrowers with a lower credit score seeking to borrow more of the home's appraised value will generally pay higher upfront fees than borrowers with high credit who are borrowing a smaller amount of the appraised value (i.e. lower LTV or loan-to-value ratio). Here's an example of how this is currently stratified based on credit score and LTV:
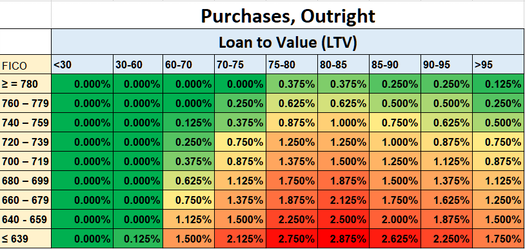
You may notice that some higher LTVs have lower costs after the 80-85 LTV level. This is a factor of higher mortgage insurance premiums.
You may also notice that the changes in costs are relatively linear as we move up and down the credit score range. Things weren't quite so linear before the most recent set of changes, and that's created big differences in pricing for the average borrower. The following chart shows the changes in LLPA cost for purchase loans.

Let's consider a borrower with a 730 credit score seeking to borrow 75-80% of a home's value as an example (a very common scenario). That borrower would now be paying an additional half a percent upfront. If they were borrowing $300,000, that's $1500 in cash, or $1500 that must be financed into the loan.
Yes, many of the FICO/LTV combos improved in cost, but the contention among those in the industry is that most borrowers fall into the "red" scenarios.
Why would the FHFA do this? The official answer is simple: to promote affordable housing among the borrower profiles who need the most help (i.e. just about anyone who isn't able to put more than 5% down, and especially if they have lower credit scores). If that violates your sense of fairness, keep in mind that those with lower credit scores still pay more, just not as much more as they were paying before the changes.
Similar changes were made for refinance transactions:

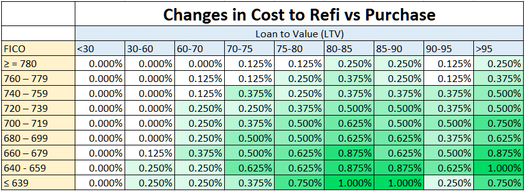
One final way the FHFA is driving toward affordable homeownership goals is to make refis more expensive than purchases. The following chart shows the relative advantage in loan pricing for those buying a home with the same FICO and LTV as those refinancing the home. In other words, green = lower cost to buy or higher cost to refi. Note that there are no advantageous changes for refinances--only purchases.
Shifting gears back to the big picture, the weeks ahead bring several economic reports that are far more important than anything seen this past week. Next week's biggest to-do will be Friday's jobs report. The following week brings the Consumer Price Index (CPI). Either of these reports is capable of causing massive volatility. The moral of today's story is that the volatility can be bad or good depending on the results.
This week's trading of Treasuries suggests markets are absolutely willing to be resilient if the data fails to send overly scary messages. In the parting example, consider the nice recovery on Friday afternoon even after the ISM Services data (a very important report) came out stronger than expected (something that would normally push rates higher, and did... but briefly).
