
This week's main event was the scheduled policy announcement from the Fed. As was the case two meetings ago, the Fed opted to hold its policy rate unchanged, but almost every other interest rate in the US moved sharply higher.
This counterintuitive movement is fairly common when it comes to the 8 Fed meetings each year. Rates have fallen on several occasions when the Fed hiked throughout this rate hike cycle. There are several reasons this can happen. Some are complicated, but two of the simplest reasons are all we need this time around.
First off, the Fed only has 8 scheduled opportunities to update rates every year while the bond market has thousands of opportunities every day. Because of that, a Fed rate hike is often just a lagging development that the market has already priced in. The Fed actually tries to avoid surprising the market when it comes to hikes/cuts. Via speeches and press conferences, it effectively preps the market for potential changes.
The market can trade these expectations in a variety of ways. The most direct is via Fed Funds Futures, which give traders a way to bet on the level of the Fed Funds Rate on any given month well into the future. Traders haven't budged in their expectation of this week's meeting resulting in a 5.375% Fed Funds Rate for months!
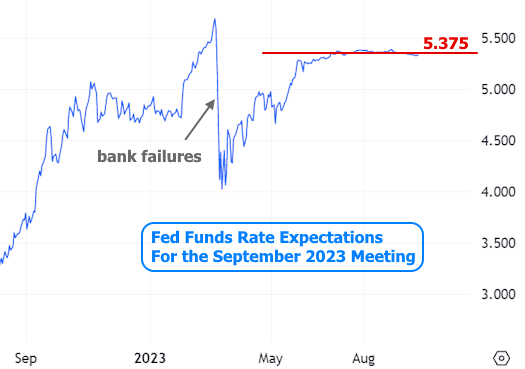
In other words, when the Fed held rates steady this week, it wasn't a surprise to anyone and the market was already priced for it. We can thus rule out the rate decision as the catalyst for the mortgage rate volatility and look elsewhere. We won't need to look far.
On 4 out of the 8 Fed announcements per year, and at the exact same moment as the Fed Funds Rate decision, the Fed also releases a "summary of economic projections." Among these forecasts is a dot plot showing where each Fed member sees the Fed Funds Rate at the end of the next few years. These so-called "dots" have become a big deal for financial markets despite Fed Chair Powell's requests to avoid reading too much into them.
The market doesn't care about the dots due to some amazing track record of accuracy from the Fed. Rather, they simply offer a very detailed update as to how the Fed's decision-making process is evolving when it comes to future rate hikes/cuts. If the average Fed member expected rates to be almost 1% lower by the end of 2024 and now only sees them being 0.25% lower, that would tell the market a lot about the Fed's intention to keep rates higher for longer, all other things being equal.
That is exactly what happened.
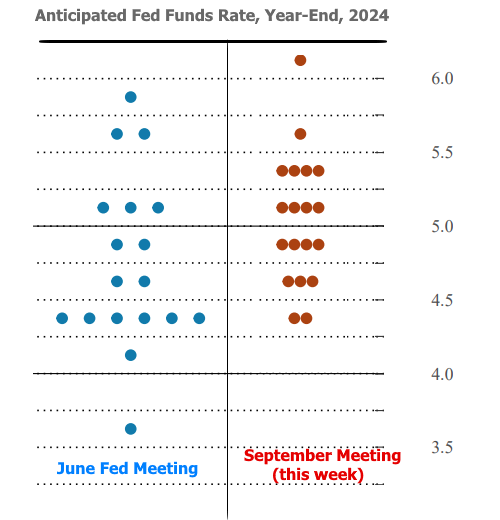
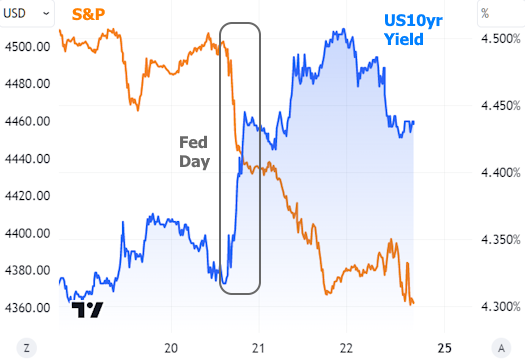
Markets expected the dots to rise, but not by this much. Neither stocks nor bonds (aka rates) were happy about it.
Traders had already been pricing in a "higher for longer" path for the Fed Funds rate based on recent economic data. In the bigger picture, this week's revelation didn't materially alter the trend in those expectations, but it did give them a noticeable bump. Here's how the market's outlook for the Fed Funds Rate in September 2024 has been evolving.
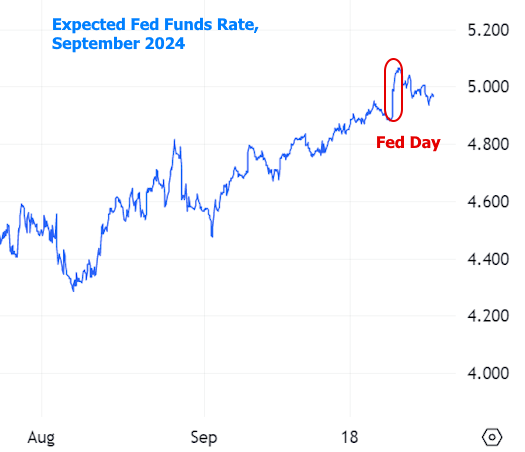
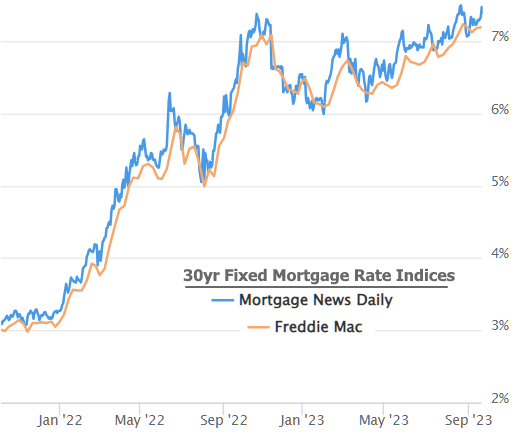
The "bump" just happened to hit when rates were already near long-term highs. The average 30yr fixed rate didn't technically break above the highest level seen last month, but it came within 0.01% based on the more timely data from Mortgage News Daily. We expect Freddie's weekly numbers will challenge multi-decade highs next week.
Why is all this happening? In a nutshell, the Fed Funds Rate is a blunt instrument tasked with fighting inflation. Inflation has been coming down, but it's still high and a bit of a rebound can't be ruled out due to things like higher fuel prices, auto worker strikes, and an adjustment in the way certain health care costs are calculated. In addition, the Fed is not yet seeing the type of downturn in economic data that would suggest impending disinflation.
That last point is a matter of debate as some critics say the Fed has already done enough and simply needs to give their policy more time to have an impact. The Fed admits that this economic cycle is different than past cycles and that there's no way to know with certainty when it's time for a friendly shift.
Regardless of who's right about the timing of a policy shift and whether enough has already been done, most can agree that it will be economic data that serves as the trigger for a change. Not just any economic data will do. The Fed and the market are both focused on several of the highest impact reports. Most of them will be released on the first week of October. If they take a turn for the worse, rates would likely recover. If they continue to surprise to the upside, so will rates, unfortunately.