
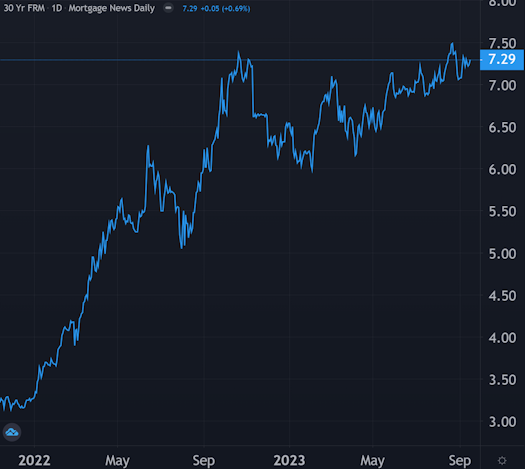
In and of itself, this week wasn't too bad for mortgage rates. Things got a bit worse overall, but the change from last week was minimal with the average lender moving up 0.07% from last Friday. There's a decent cushion between current levels and the long-term highs last month. Even the late 2022 highs were a bit higher. That said, when you put it all on a long-term chart, things don't look great.
Mortgage rates are often compared to 10yr Treasury yields because the two tend to move in very similar fashion. The assessment of the 10yr is a bit less optimistic. Yields ended Friday at their 2nd highest closing level since 2007 and repeatedly pushed up against the 4.34% level during the day (4.336% to be fair).
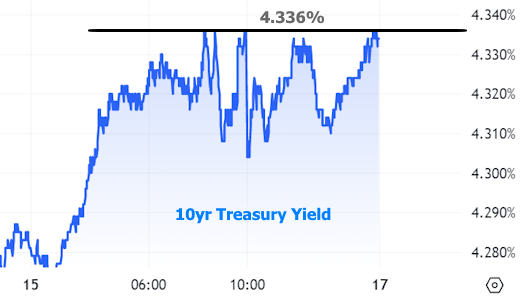
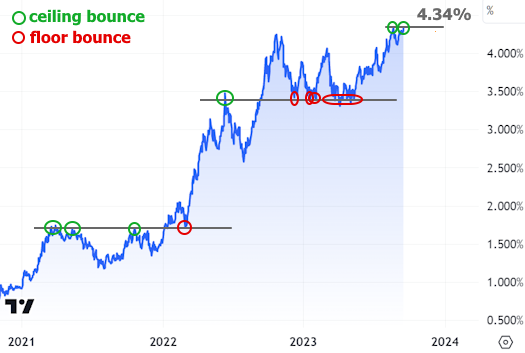
4.34% is where the 10yr ended on August 21st. It remains the highest daily closing level since 2007 so repeated flirtation is important. When a bond yield (or any other financial market security, for that matter) exhibits this bouncy behavior around a previous extreme, it becomes known as a "technical level" by a large portion of the trading community.
Technical levels go by many names (key level, pivot point, inflection point, or simply "ceiling"). A technical level can be a ceiling if it acts like a ceiling, but it can be an inflection point if it is subsequently broken.
Some traders think they're quite important while others couldn't care less. But even the non-believers are at least aware that other traders are aware of obvious technical levels. Because of that, any big bounce or breakout involving such a level can receive a bit of extra momentum. And 9 times out of 10, a big motivation for 10yr yields is a similarly big motivation for mortgage rates.
4.34% stands a good chance of seeing a clear bounce or breakout surrounding next week's Fed announcement. That, in and of itself, may not matter too much. Yields often spend much more time flirting with floors and ceilings before making up their mind.
The Fed doesn't directly control longer term rates like mortgages or the 10yr Treasury yield, but it does set the shortest term rate, thus providing an anchor for everything else.
The Fed is not expected to change its rate this time around, but even when the anchor holds steady, the Fed can say things that cause hope and fear about how the anchor might move in the future. In turn, this can cause movement in other rates--sometimes significant movement.
Despite the higher potential for volatility, the Fed's anchor moving game plan is ultimately dependent on economic developments. The motion of that ocean has rates feeling queasy recently as most of the data has come out stronger than expected.
Strong data is technically a good thing. A strong economy means plentiful jobs, income, and spending. But when the economy is too strong, and when that strength coincides with higher prices, the Fed steps in to raise short term rates in the hopes of making everything so expensive that people can't buy as much stuff, thus cooling the economy back down to a more sustainable pace of growth.
There is broad disagreement among market experts about whether the Fed has already done enough to accomplish this goal. Some think rates need to be cut immediately (won't happen). Others think the Fed needs to hike again at this meeting (won't happen). And most think the Fed will hold steady (will happen). What no one can truly know right now is how long the Fed needs to hold steady before doing something else. Nonetheless, several reporters will likely ask different versions of that question to Fed Chair Powell in the press conference that follows Wednesday's announcement.
In addition to--and perhaps more important than--the announcement or the press conference, the Fed also releases its quarterly update on economic forecasts. This includes the famous "dot plot" that shows where each Fed member views the Fed Funds Rate at various points in the coming year. Even though Powell frequently downplays the significance of the proverbial "dots," markets nonetheless view them as a veritable navigational chart for future anchor movement. At the very least, it lets traders know how the Fed's assessment is evolving in light of new economic data.