
Interest rates of all types have been under immense pressure since the beginning of 2022. That's when the Fed began raising rates at the fastest pace in decades to the highest levels in decades in order to combat a similarly fast-paced spike in inflation.


This particular era of Fed rate hikes is particularly aggressive because the Fed got a late start in responding to price pressures. They argued that policies needed to remain accommodative for longer due to economic uncertainties surrounding covid. This is in stark contrast to the only comparable hyperinflation episodes starting in the late 70s. In the chart below, notice the orange line (Fed Funds Rate) moving higher sooner and bigger than inflation. The opposite is true of the present rate hike campaign.

The Fed Funds Rate doesn't directly dictate mortgage rates, but in general, tighter Fed policies put upward pressure on rates across the board. Mortgages are not immune.

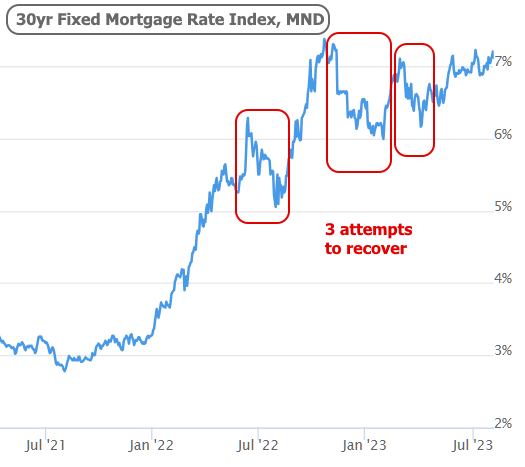
As rates have risen, there have been several instances of relief and hope. These have occurred in part due to legitimate shifts in the data that suggested the worst might be over and in part due to the belief that things had moved too far, too fast to be sustained. In July and November 2022, it was economic data that helped. In March 2023, it was the bank failures. Each attempt has been thwarted with the most recent being the most gradual. It also represents the best example of the rate market coming to terms with a "higher for longer" reality that it didn't want to believe during the last two recovery attempts.
The net effect is that rates have been near their highest levels in 23 years for the longest stretch of time since the average 30yr fixed rate first crested 7% in November. NOTE: not every rate index is over 7%, but the following index accounts for upfront "points" that make other indices slightly lower. As always, the best way to use a mortgage rate index is to observe changes in relative terms. Actual rate quotes can vary widely for a wide variety of reasons.
Is there any hope for relief? There's always hope. The only question is one of timing. Timing will depend on economic data and inflation, among other things. Markets got a glimpse of just that sort of relief on Friday following the big jobs report from the Labor Department. It was still very strong in a historical context, but not quite as strong as economists had predicted.
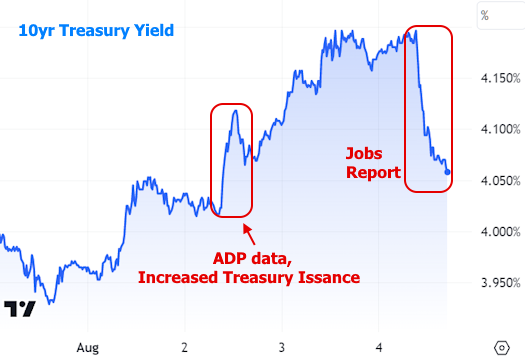
Up until then, rates were in a bit of a panic this week due to a confluence of other data and events. Wednesday was saw the biggest jump after the ADP employment data and an announcement regarding the government's anticipated borrowing needs (via Treasuries).
U.S. Treasuries are at the core of the rate market. When investors become less interested in buying them or when the government becomes more interested in selling them, rates rise. The ADP data hit the demand side of the equation and the Treasury announcement hit the supply side. We can see how things played out in the following chart of 10yr Treasury yields as well as the much-needed response to Friday's more important jobs report.
Despite Friday's recovery, current rate levels are still uncomfortably close to long-term highs. It merely served to show us how "hope" can work. In order to see more of it, we'll need more data to make similar suggestions.
So what's the next big economic report to watch? Easy! The Consumer Price Index (CPI) on Thursday, August 10th. CPI is the only other piece of scheduled monthly economic data that could compete with the jobs report over the past 2 years when it comes to impact on rates. The last CPI report was good for rates, but the market needs to see a pattern that's repeated for several consecutive months. If inflation is lower than expected this time around, it would be a solid step in that direction, one that likely allows rates to continue to moderate after this week's push toward long-term highs.