
Inventory! That's been a buzzword for the housing market for more than a decade, but it's been especially prevalent in 2023 as the excuse for slower home sales. How good of an excuse is it?
Before digging into that question, let's take a look at the data that needs to have excuses made for it. This week brought the monthly release of Existing Home Sales from the National Association of Realtors (NAR).
Existing sales began the year with a pop, but have consistently been fading since then.

The chart above captures all-time highs and 12-year lows all in the space of few years (thanks Covid).

When it comes to explaining the slump, the National Association of Realtors places INVENTORY at the top of the list. And while no one should disagree that more inventory would result in more home sales, perhaps we're overlooking the bigger issue: RATES.

In the NAR's defense, they're quite aware that rates are a problem. But the recent hyperfocus on inventory might be overdone. After all, wouldn't many more homeowners consider moving up if they weren't faced with the prospect of giving up their 3% mortgage in exchange for something closer to 7%?
"There are simply not enough homes for sale," according to NAR Chief Economist Lawrence Yun. "The market can easily absorb a doubling of inventory."
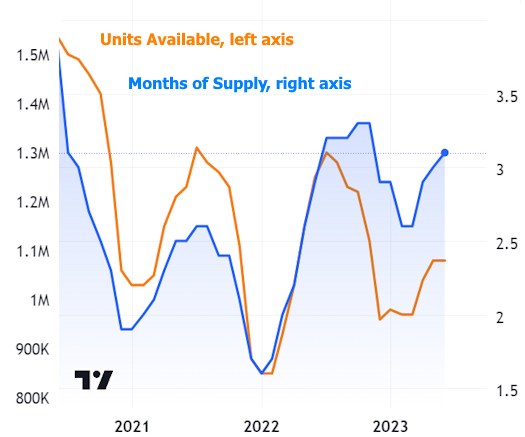
To be sure, more inventory would be a good thing in almost every regard. A doubling of inventory would likely keep prices in check or push them slightly lower, but it might not conjure up as much buying demand as you might assume. Two separate stats in the Existing Home Sales data illustrate the point. The first is for inventory in terms of UNITS.

This chart makes it seem as if inventory is in line with all time lows and not building as quickly as it normally does at this time of year. But the takeaway changes a bit when we look at inventory in terms of "months of supply."

Since it's not incredibly easy to quickly glean the takeaway from the two charts above, here you go: in terms of units, inventory is nowhere near mid-2020 levels while "months of supply" is well above. Let's zoom in:
In separate data released this week, we saw more evidence of moderation on the demand side of the home sales equation. Housing Starts (the ground-breaking phase of new construction) were revised much lower after last month's surge and the current month's data came in just below forecasts. Without a doubt, the construction side of the market is doing much better than the resale side relative to pre-covid levels, but it's also only about a quarter of the market.
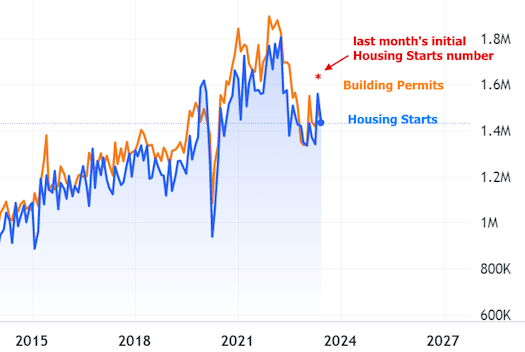
Nonetheless, homebuilders remain more optimistic than they were at the beginning of the year according to other data out this week from the National Association of Home Builders (NAHB).

If high rates are a root cause of the housing market issue (and no, we're not ignoring the fact that low rates served as a sort of root cause in 2020-2022, acting to pull forward a significant amount of home sales volume), what's the root cause of high rates and what will it take for things to change?
As we discussed last week, it's almost all about inflation. Last week's friendlier CPI data helped rates move sharply lower. But this week's labor market data pushed back in the other direction. The following chart of 10yr Treasury yields shows the relative movement in the rates market.
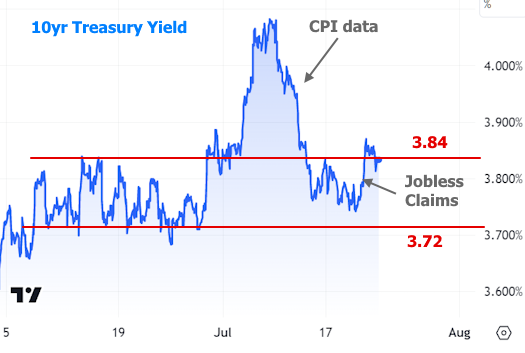
Mortgage rates tend to follow a similar path to 10yr yields over time, so it's no surprise to see mortgages a bit higher versus last week with the average top tier 30yr fixed rate back around 7%. Freddie Mac's index covers the 5 weekdays leading up to Wednesday on any given week. During that time last week, rates were indeed much higher than the 5 days leading up to this past Wednesday.

In other words, Freddie's survey hasn't caught up to reality yet. It also runs a bit lower on average because it doesn't adjust for upfront costs whereas Mortgage News Daily does. That means a quote of 6.625% with 1% discount paid upfront would be recorded as 6.625% by Freddie, whereas the rate with no discount points would be closer to 7.125%.
Rates will receive their next big dose of information next week when the Fed announces its latest rate hike. The market already knows the hike is coming, so that part won't be a market mover. Rather, traders will tune in to hear what Powell has to say about how the outlook may be changing in light of recent progress on inflation. There's a chance the market comes away from next week's Fed hike with the sense that it was the last hike in a long time. Of course there's also a chance that Powell is concerned about market exuberance and thus doubles down on the higher rate narrative. There's no way to know which direction rates will go on Wednesday, only that the risk of volatility is bigger than normal.