
Mortgage rates spiked abruptly last week after several economic reports showed the economy doing better than expected. Now this week, key inflation data showed prices falling faster than expected. Rates responded with a full recovery.
If rates could only choose one thing to be afraid of, it would be inflation. Rates are based on bonds. Bonds offer investors a fixed schedule of cash flow. Over time, inflation can make that cash buy much less "stuff" than it did at first. Investors compensate by demanding higher rates of return, and that is essentially the short version of the great post-covid rate spike.
Up until this week, the most closely-watched inflation metric had been consolidating in an increasingly narrow, sideways pattern, but still at elevated levels. While it's only one month of data, this is the promising breakout that fans of low rates have been hoping to see. In one fell swoop, the monthly pace of inflation is back at the lowest levels since early 2021.

Year-over-year inflation is also looking good, especially when energy and food prices are factored into the mix (blue line below):
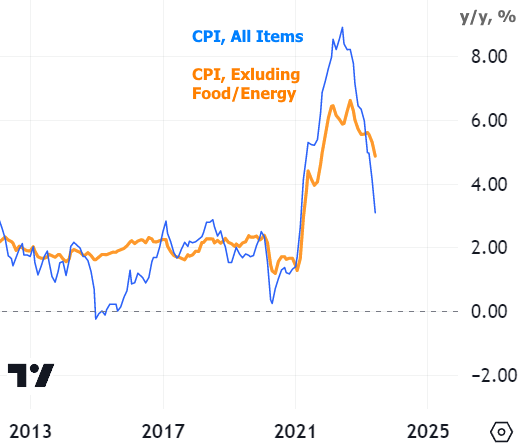
The chart above illustrates the predicament for policymakers. The Fed sets short term rates in an attempt to constrain the economy and push inflation back to an annual pace of 2%. They focus on core inflation (orange line). As seen in the chart, we're still quite a ways from 2%, and it will take another year of reports like the one we just saw before we're back in that range. So the Fed has to decide if the current level of the Fed Funds Rate is enough to get us there with certainty.
On that note, the market expects the Fed to hike at least one more time in 2 weeks, but then to be even more heavily dependent on economic data. Looking ahead to the market expectations for the December Fed meeting, we can already see the Consumer Sentiment data push back against the positive impact from CPI.
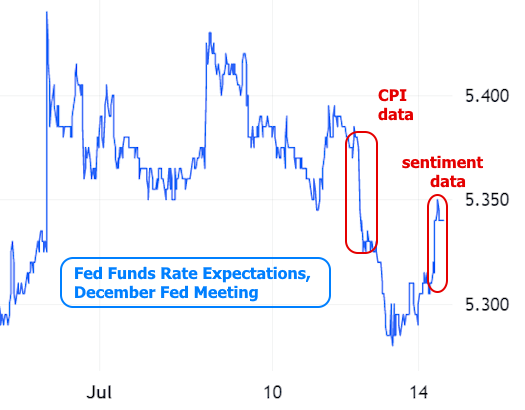
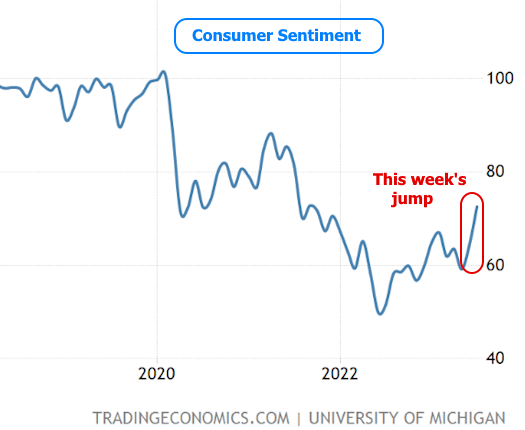
Consumer Sentiment normally doesn't compete with CPI when it comes to impacting rates, but this week's report was very strong.
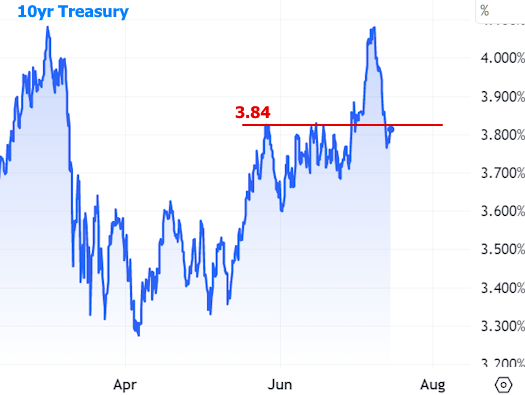
Longer term rates like 10yr Treasury yields followed a similar path to the Fed's rate hike outlook this week, but they were more interested in the inflation data and less sensitive to the "yeah but" offered by the Consumer Sentiment data. Stocks were also more focused on CPI (and its implications for a friendlier Fed... a rising tide that tends to help stocks and bonds simultaneously).

In the bigger picture, yields are still very much in a holding pattern, but have notably made it back below the 3.84% level that had acted as a consistent ceiling up until last week.
Speaking of last week, the rate spike resulted in the Freddie Mac mortgage rate index jumping much higher this week, but don't be alarmed. Freddie takes an average of the trailing 5 days. In terms of actual daily averages, rates fell sharply during the first four days of the week, and avoided losing too much ground on Friday.

Looking ahead, we're in a bit of a summertime lull next week with none of the massively important economic reports seen over the past 2 weeks. It will also be the "blackout period" for the Fed. That refers to the 12 days leading up to a Fed announcement where Fed speakers abstain from commenting on policy. As such, the market sometimes speculates a bit more than it otherwise would about what the Fed is thinking, but that's typically a bigger risk when the blackout period coincides with highly consequential data. Either way, this week's gains are merely a start. It will take several more weeks--if not months--of economic data to conclusively shift rate momentum in a friendly direction.