
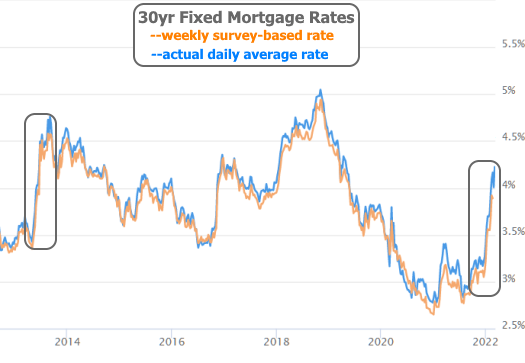
The Fed will hike its key policy rate for the first time since 2018 next week, but mortgage rates aren't waiting to move higher. By the end of this week, they were as high as they've been in nearly 3 years.
The mortgage market has long since moved on from caring about next week's hike. It was a foregone conclusion by mid January. Rather, mortgage rates have been responding to a perfect storm of problems that have combined to push the average 30yr fixed rate higher at its fastest pace since 2013.
2013 actually shares a key ingredient with our perfect storm: Fed bond buying.
In response to the 2008 financial crisis, the Fed announced the first of what would be several episodes of large scale bond purchases designed to stave off deflation and encourage economic growth (technically known as quantitative easing or QE for short).
QE tends to put massive downward pressure on rates at first, but rates move logically higher after that. The rate spikes are especially sharp when the Fed communicates a QE wind-down that the market wasn't fully expecting. That's what happened in 2013 when the Fed officially announced its intent to taper its bond purchases. The resulting rate spike was thus dubbed the "taper tantrum."
Fast forward to early 2022 and the market endured a similar tantrum. As in 2013, traders knew the Fed wouldn't be buying bonds forever. In fact, the Fed had already announced tapering in late 2021, but they surprised the market by accelerating the pace of tapering in January. Adding insult to injury, they also reiterated their desire to hold only Treasuries in their bond buying portfolio and not the mortgage-backed bonds that more directly benefit mortgage rates.
Tapering is merely a decrease in the amount of bonds purchased by the Fed. When the Fed actually decreases its bond holdings, that's known as "normalization." This was another complicating factor for rates in early 2022 as the Fed promised a much faster move from tapering to normalization (months instead of years).
These policy shifts alone were enough to cause the mortgage market to underperform the broader bond market more than at any other time since the 2008 financial crisis (the chart below measures this underperformance). The only exception would be March 2020, but for several great reasons that month of market movement should only be compared to itself.

Underperformance is one thing, but what if the "broader bond market" is doing OK? Couldn't rates actually hold steady if Treasury yields (the benchmark for the broader bond market) were falling?
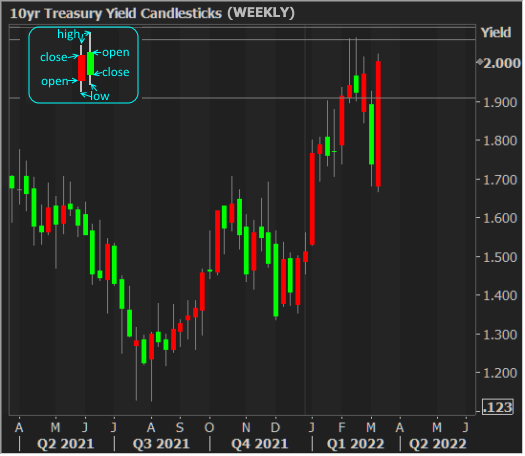
Totally! But unfortunately, Treasury yields aren't falling. They just had their worst week since 2016 (again, we're not including March 2020 in any comparisons). Granted, it wouldn't have been quite as abrupt if the previous week hadn't seen a volatile move toward lower rates due to Russia/Ukraine war, but Treasury yields are nonetheless near their highest levels since mid 2019.
In essence, the market has quickly returned to pricing in an aggressive Fed rate hike campaign in 2022, even if it only sees the Fed hiking by a normal 25 basis points (aka 0.25% or 25bps) at next week's meeting.
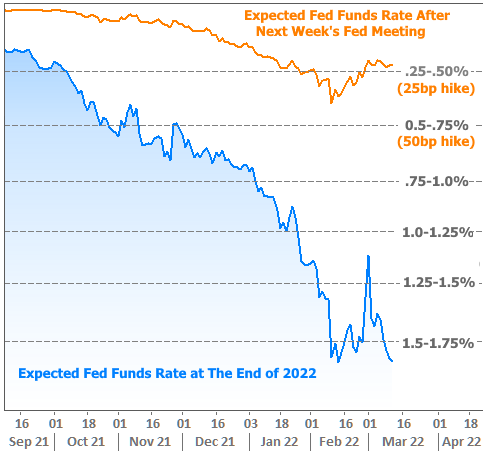
The following chart shows how the market's Fed rate hike expectations have shifted in recent months, both for next week's meeting as well as the entirety of 2022. Here are some notes on how to interpret it:
- The closer the orange/blue lines are to one of the dotted level lines, the more the market anticipates that level for the Fed Funds Rate. In other words, back in mid February, the market saw a 50bp rate hike as a strong possibility.
- Remember that the Fed sets rates in 25bp increments. The current Fed Funds Target Rate is 0.00-0.25% (hence .25-.50% would require a single 25bp hike).
Why has the rate hike expectation ramped back up to its recent maximum levels despite Ukraine (i.e. blue line is at its lows)? In a word, inflation. Indeed, 10yr yields would still be down in the 1.7% range were it not for the quick ramp in inflation expectations.
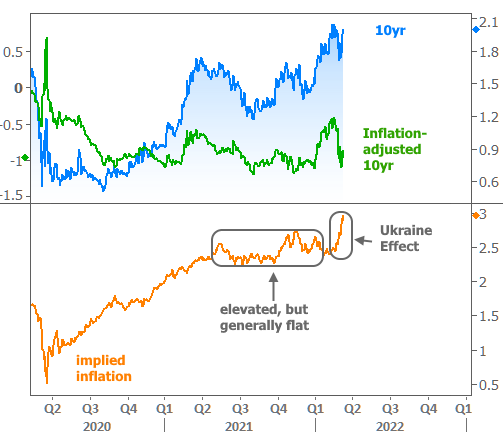
The following chart shows movement in actual 10yr Treasury yields and inflation-adjusted yields. These would be too far apart to see any meaningful detail on a shared axis, so they're overlaid on separate axes to show correlation. When inflation expectations are stable, these two lines would correlate almost perfectly. In this case, the fact that the blue line is leaping up and away from the green line means that the spike in bond yields is being driven almost exclusively by inflation expectations.

Is this due to Ukraine or was the ball already in motion?
While inflation expectations had been ramping up significantly as the market bounced back hard from the initial pandemic-related shocks, it had been doing a better and better job of leveling off before Russia invaded Ukraine. The following chart shows the exact same lines as the previous chart, but over the past several years.
Why is the Ukraine war driving inflation?
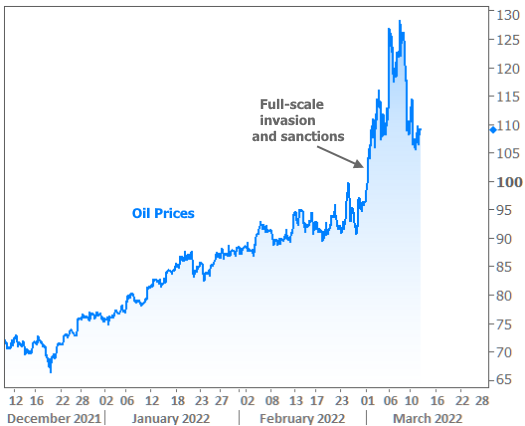
For a variety of reasons, several commodities are experiencing unprecedented price surges as a result of the Ukraine war. Oil prices are getting most of the attention, and rightfully so. Oil is intertwined with the cost of almost everything as long as the world relies on it to move almost everything. Prices were already rising steadily as production was struggling to keep up with the increased demand coming out of the pandemic, but Russia's invasion of Ukraine sent oil screaming another $20/barrel higher.
How much do inflation and oil prices have in common?
Here's that same orange line of "implied inflation" on the same chart with oil prices:

Bottom line, everything hinges on inflation right now. That was already true before Ukraine, and now it's painfully true. Inflation is the Fed's key consideration in making changes that have pushed rates higher. From here, markets will be paying even closer attention to oil prices and inflation metrics. They'll also be listening intently next week as Fed Chair Powell comments on whether the Fed's reaction function might change again in light of the commodity price surge.
