
Have you heard the one about "all-time low" mortgage rates? It's been in the news quite a bit over the past two weeks, but it's massively misleading. Rates are definitely not at all-time lows, although they're close in some cases.
What's really going on here? Who decides if rates are at all time lows anyway?
Most news stories making this claim are relying on Freddie Mac's weekly survey data, and that's a problem. It's not that the data is bad or wrong--just that it's limited.
Freddie's survey doesn't count the 2nd half of any given week. It also tends to move more slowly and conservatively than actual lender offerings. As such, it misses a lot of solid milestones, like the true depth of the all-time lows that occurred in early August. Rates have been no lower since then.
Additionally, Freddie asks for a best case rate rather than an average. That's a problem right now due to the recent implementation of a new refinance fee. This fee caused significant volatility starting in August, and it means that refinance rates are clearly higher than purchase rates. Considering a majority of new mortgages are refinances, this detail is reasonably important!
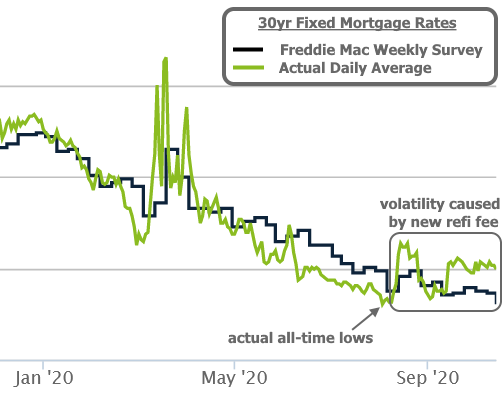
To sum all this up, if you're BUYING a home, you may be seeing rates that are CLOSE to recent all-time lows. In some cases where a specific lender has improved pricing better than their peers in the past 2 months, you could actually be seeing an all-time low (for that lender). But if you're refinancing, your rate quote--while still historically low--is not quite an all-time low.
Perhaps more important than the outright level of interest rates is the risk of volatility on the horizon. With everything the economy and financial markets have been through in 2020, the past few months have been surprisingly calm in the bigger picture--especially for the bond market (which has a direct bearing on mortgage rates). But there are several reasons we should be prepared for more volatility ahead.
Election. The US presidential election is weeks away. First off, this always has potential to cause market volatility. Moreover, markets seem to be getting in position for bigger movement. Both stocks and bonds are at the same levels seen in early September, and both have been flat in the bigger picture since then. Even without the election, that flatness tends to precede volatility.
Covid at home. Covid-related news is ongoing, of course. Markets continue to show a willingness to react to significant changes in case counts, vaccine trials, new treatments, mortality, and the anticipated economic effects of all of the above. Winter is coming, and we're about to learn 'something' either way. If the fight against the pandemic goes better than expected in the coming months it implies significant upward pressure on rates.
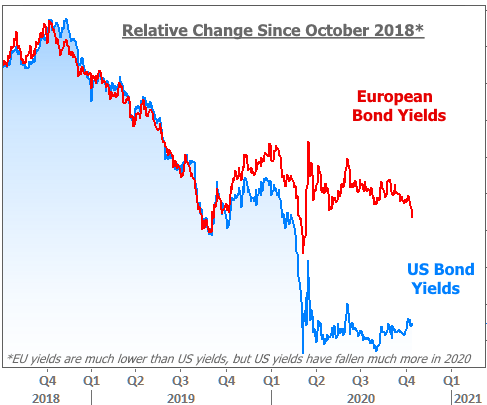
Covid abroad. Europe is arguably entering a new covid crisis. This has been helping the US bond market rethink its recent efforts to push toward higher rates.

If the situation continues to spiral, it should continue to help bonds, but only as a supporting actor. US bonds have already proven more than capable of marching to their own beat, post-covid.
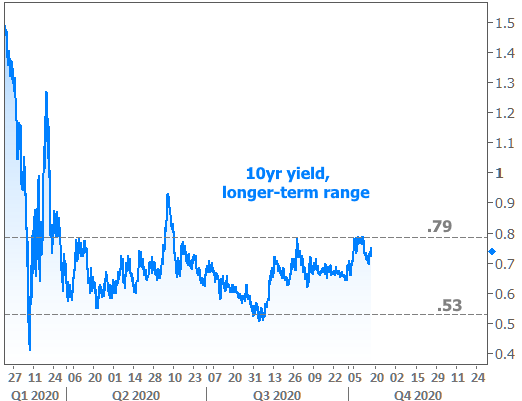
Stocks, Bonds, Technicals! 10yr Treasury yields broke out of a shorter-term range this week. They added emphasis to that breakout by failing to get back into the previous range despite several attempts this week. In other words, they bounced at 0.72 as a floor after it had been a ceiling more often than not in the past few months.

Such behavior often implies additional momentum toward higher rates, but importantly, there is a longer-term range that remains unbroken.
Stocks were on a tear before the big sell-off in early September (the one that seemed to help bonds calm down and remain in the shorter-term range). Stocks haven't made it back to recent highs. Now, both sides of the market seem to be consolidating--circling the wagons, if you will--in preparation for their next move. The timing of the presidential election and the anticipation for an impending stimulus deal are no coincidence, but markets may not be able to wait that long to make a move.
In the chart below:
1) the big stock sell-off that helped bonds calm down
2) stocks and bond yields moving higher together, but no higher than they have been in recent months.

Any Caveats?
Yes! Let's talk about one! With all of the above out of the way, there's at least one great reason to expect slightly less volatility in mortgage rates relative to the broader financial market. The reason is also very simple. Mortgage rates may be very low, but they haven't fallen remotely as quickly as their long-time companion and guidance giver: US 10yr Treasury yields. Most of the time, 10yr yields and mortgage rates look like the left side of the following chart. Things obviously changed post-covid.

What this means is that the mortgage market has some room to "soak up" a certain amount of weakness in the broader bond market. The more gradual the weakness is, the easier that would be. If 10yr yields are spiking significantly, don't expect mortgage rates to just take it in stride. But if yields are slowly working their way up from .75% to 1.0% in the coming months, it wouldn't be a huge surprise to see mortgage rates hold relatively sideways.
