
Although the first three weeks of the year weren't inconsequential, investors were understandably eager to react to Trump's first week in office. One of the most notable developments was a break higher for stock prices after weeks of stagnation. This had the unfortunate effect of pushing bond yields (aka "rates") even higher.

Although this brought mortgage rates to 2017 highs, the broader range remains intact. In the context of that range, late-December through mid-January provided an opportunity for rates to undergo a correction from an incredibly abrupt post-election spike. The first 3 weeks of January were like a holiday break, and now it's back to business.
Further increases in rates raise legitimate questions for mortgage and housing markets. Certainly, we've already seen the effects on refinancing activity, but that's to be expected any time rates rise this quickly. In fact, refi applications tend to have a fairly predictable lower boundary.
As I mentioned in previous newsletters (both in Nov and Dec), because of that lower boundary, refi activity didn't have as far to fall this time around compared to 2013. Recent lows in the MBA's weekly Mortgage Market Index confirm that refi applications have bounced at expected levels.

True to form, purchases have been much less affected by the rate spike, but that's partly due to the timing of housing reports. In the chart above, the numbers cover the previous week's applications. In the world of housing data, that's timely! Most reports cover the previous month's data. That means we're just getting December's New and Existing Home Sales numbers this week.
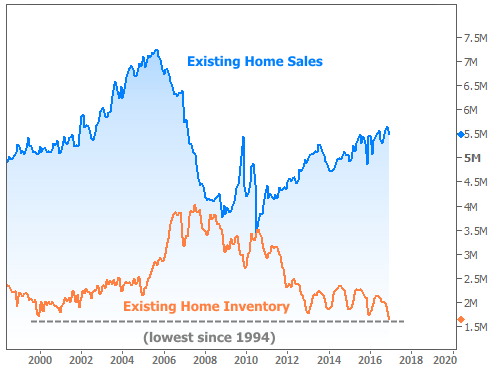
Existing Home Sales fell moderately to an annual pace of 5.49 mln from last month's estimate of 5.65 mln. Despite the decline, 2016 was unsurprisingly stronger than 2015. The most interesting facet of the report was a plunge in inventories to the lowest level since 1994.
What's preventing homeowners from listing their homes? It's not a one-dimensional issue. Some sales simply aren't counted because they're not occurring in traditional channels (pocket listings and certain distressed sales). We also know mobility needs have decreased which lowers the organic level of demand for home-buying.
More tangible factors include rising prices of new homes coupled and rising rates. That's a combination that prevents some would-be new home buyers from moving up (thus NOT adding to existing home inventory, as seen in the chart above). This week's New Home Sales data doesn't disagree. Sales fell sharply while prices remained pressed up against all-time highs.

This is part of the catch-22 of new fiscal policies and a potentially growing economy. If the economy can grow at a faster pace and if fiscal policies are adding to inflation pressure, rates will continue to rise. In turn, higher rates hinder further economic activity--especially in the housing and mortgage markets. Decreased economic activity and inflation pressure would allow rates to fall again, but most experts agree that's a ways off.
Separate economic data this week suggested that near-term concerns about economic growth could remain on hold for a while longer. The first reading on Q4 GDP came in at +1.9 percent versus a median forecast of +2.2 percent.
Next week brings several of the most significant economic reports, including the all-important jobs report on Friday. In addition, we'll get an updated statement from the Fed on Wednesday. While investors will try to glean clues from any changes in the Fed's verbiage, there's effectively no chance of a rate hike this time around.
