
It was a fraught week for rates and housing, with plenty of movement in financial markets and plenty of contradictions in economic data.
There are ample talking points for optimists and pessimists when it comes to the current state of the housing market. Let's start with the good news.
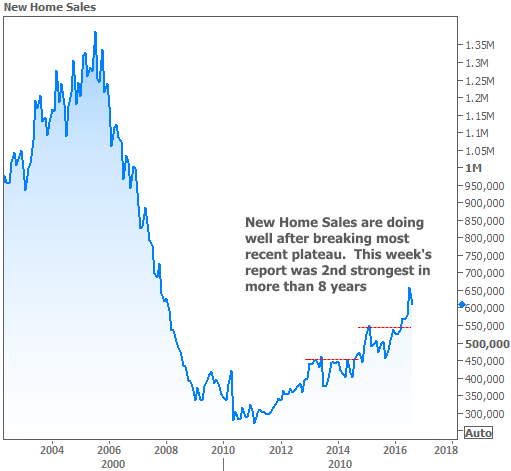
The week's first major economic report was New Home Sales for the month of August. This one was worth watching because July's report was so strong that many economists chalked it up to the report's typically high margin of error. Indeed, this often results in "big gains" turning into "big losses" by the time revisions come in.
That was not the case this time around. Not only were July's numbers vetted, but August's were also stronger than expected. Next to July, it was the 2nd best report in more than 8 years. Housing pessimists might try to call attention to the fact that sales still aren't halfway back to their pre-meltdown peak, but even they'd have to concede the unsustainability of 2005's levels of new construction.
Housing skeptics have more room to talk when it comes to the issues of price plateaus, affordability and inventory. Virtually every other housing-related report released this week (and there were a lot!) addresses these topics in some way.
Black Knight's Home Price Index, one of several mainstream price indices, showed a distinct slowdown in price appreciation over the past few months. Another highly-regarding index, Case-Shiller, was more equivocal on the the month-over-month trend in appreciation. Instead, it called attention to the logical unsustainability of price appreciation (running over 5 percent, according to most measures) relative to core inflation, which remains near 2 percent.
In that same vein, ATTOM (previously RealtyTrac) released a report focused specifically on affordability. It noted that 24 percent of the counties in its study were less affordable than their historical average, compared to 22 percent in the 2nd quarter and 19 percent last year.
In slightly more upbeat news, 2 reports from CoreLogic spoke to decreasing levels of distress in housing markets. The first showed that distressed sales themselves only increased in 8 states and had fallen 2.2 percent year-over year. The second was more of an indirect comment on "distress," noting that all-cash sales dipped below 30 percent in June--the first time that's happened since 2007.
All of the above dovetails into what the National Association of Realtors considers the core issue facing housing at the moment: INVENTORY! This has been a constant battle cry for the NAR, and one that seems to explain the juxtaposition of unsustainable price gains and relatively stagnant wage/inflation growth.
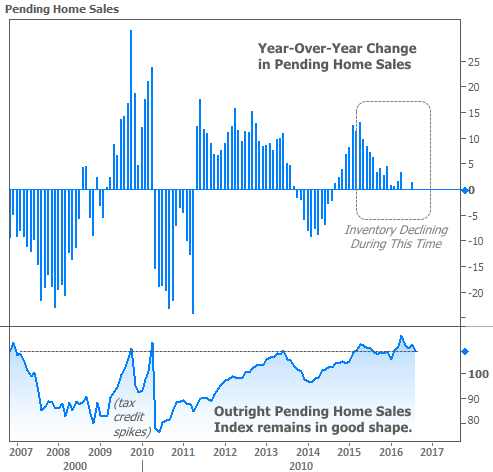
Inventory is increasingly being used to explain declining momentum in Pending Home Sales, a leading indicator of purchase contract activity. The NAR notes that inventory has contracted in 15 straight months. This exactly matches the decline in year-over-year growth in Pending Sales, seen in the chart below.
One fairly constant source of positivity for housing markets is the interest rate environment. Although mortgage rates aren't officially at all-time lows at the moment, they've been spending more time NEAR all-time lows than at any other time in history.
Whether that continues to be the case depends largely on central bank policies. Recent rate volatility began after the European Central Bank hinted that it might be a little less generous with easy money policies in the near future. Last week's Fed Announcement helped rates (and stocks) find their footing, and that recovery continued this week.
One classic sign that markets are reacting to central bank's easy money outlook is the divergence of stock prices and bond yields (aka "rates"). Over most short-term time horizons, rates tend to move the same direction as stocks, but when markets see the proverbial "punch-bowl" of easy money at stake, stocks and bonds usually lose ground together (meaning rates move higher while stock prices move lower, and vice versa).

