
Last week's newsletter posed the question: what will it take to break the holding pattern in housing and markets? Now, this week's data has provided a wide array of answers.
Interest rates, however, continue abstaining from any such answer. In fact, by some measures, rates have never been less volatile than they are right now. The following chart shows the current pattern of consolidation in 10yr Treasury yields (a good proxy for all longer-term US interest rates, like mortgages), as well as the longer-term consolidation earlier this year.
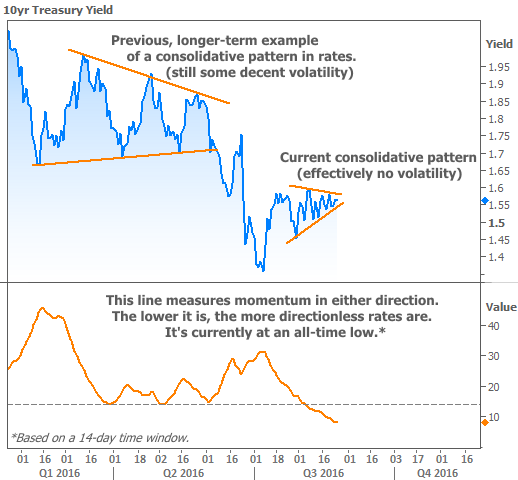
These instances of consolidation are typically followed by a period of higher momentum. You can see how the early-2016 example resulted in higher momentum toward lower rates. But it's important to understand that the momentum can happen in either direction. Given that we're running out of room in the current consolidative pattern, the next move could be happening very soon.
Rates aren't the only thing that's been consolidating in a narrow range. Data out this week shows that Existing Home Sales continue to operate in the same general range that's dominated the past 2 years. But unlike rates, the details here are quite interesting. Specifically, the National Association of Realtors cites increasingly severe appraisal issues, saying they're responsible for more than a quarter of contract delays in the past 3 months.

Appraisals are less of an issue when it comes to New Home Sales, and it shows in this week's report from the Census Bureau. Granted, New Homes fell harder during the Great Recession and consequently have more room to grow, but the trend is positive nonetheless. In fact, July's sales increased at the fastest pace in more than 10 years!
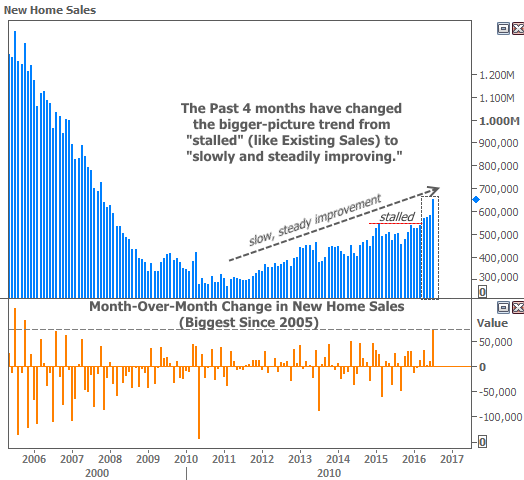
There are a few caveats, depending on your point of view. Critics often point out that this data series has a notoriously wide margin of error. But even so, it would take a massive revision to alter the positive trend seen in the chart. In separate news, the National Association of Home Builders (NAHB) pointed out a noticeable increase in the amount of homes being built specifically as rentals. Some would argue that's not a good thing for the long-term growth outlook for the housing market.
Adding yet another layer of complexity to the housing outlook, the FHFA (which oversees Fannie and Freddie) said this week that it sees a "potentially significant shift" in home price trends. While FHFA's home price index still shows year-over-year growth of 5.6 percent, it notes that month-over-month appreciation has been much smaller recently.
On a mortgage-specific note, the FHFA balanced things out with some upbeat news. The longstanding HARP program will be extended through September 2017, at which point it will evolve into a new high-LTV program. The most important feature of the new program will be an absence of cut-off dates, which previously prevented many potential borrowers from taking advantage of HARP.
The week ahead brings a slew of important data, including the big jobs report on Friday. At the same time, investors will be digesting and reacting to the much-anticipated comments from Fed Chair Yellen at the Jackson Hole symposium. We'll discuss all of the above in next week's newsletter.
