
This was supposed to be the week where a key inflation report would cast a vote on the fate of interest rate momentum. The vote was ostensibly friendly but rates surged higher anyway. What gives?
First off, let's revisit why rates would care so much about an inflation report. CPI (the Consumer Price Index) is the biggest monthly report on inflation in the US. Inflation is the key reason that rates are as high as they are. If inflation falls back to target levels, rates would theoretically move lower in concert.
Last month's CPI was good for rates because it came in below the consensus (the median forecast among multiple economists). It was also a noticeable departure from a highly indecisive trend at elevated levels that, until then, had simply refused to decide whether it would move higher or lower.

As seen in the chart above, the indecisive trend resolved toward lower levels last month with core inflation falling to 0.16%. It matched that same level in the new data released this week. If this were the only thing that mattered to interest rates, rates would be much lower than they are today. Alas, rates found other things to worry about. The following chart of 10yr Treasury yields serves as a benchmark for this week's rate movement (starting with last Friday's jobs report).
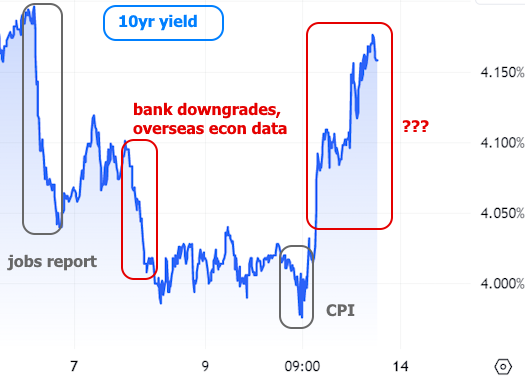
If we take the 10yr yield's word for it, rates are thinking less about inflation and more about other things. Part of the reason is that inflation still has to prove it can maintain this trajectory. Annual numbers remain far from target levels, especially at the core level.
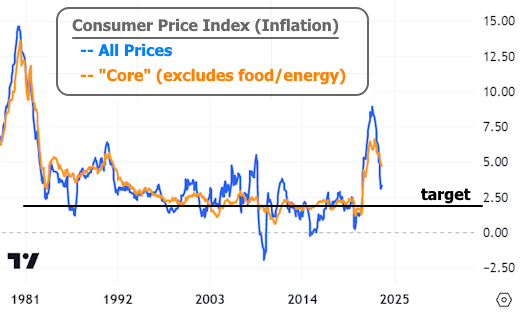
The recent rise in oil prices has some economists thinking that the next few inflation reports might not result in the same easy victory. Oil doesn't always dictate day to day changes in the rate market, but there's no question about its broad correlation with inflation (note: correlation isn't necessarily causality, as can easily be seen amid rising oil prices and falling inflation between 2011 and 2014).

If we take a bigger step back to examine the longer term trends in rates, we can see that the market was more willing to head toward lower levels between late 2022 and May 2023. Since then, rates have trended higher with a purpose and, notably, without paying much attention to tamer inflation data.

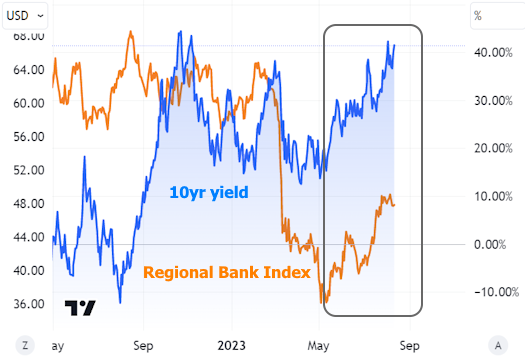
One hugely underappreciated factor in the summertime rate saga is the role of banking sector fears. Up until March of 2023, there was really no discernible progress toward lower rates. Bank failures led to an immediate drop and rates have only slowly been inching back toward previous levels.

The regional bank stock index bottomed and bounced at the same time rates abandoned their attempts to continue moving lower.
Longer term rates have also had to consider that they are increasingly responsible for the brunt of the bond market's response to economic data and Fed policy. This is an esoteric concept, but it has to do with the fact that bonds exist with varying levels of duration (aka life spans) and that shorter duration bonds have a slightly different set of concerns than longer term bonds.
For instance, the shortest terms bonds are almost perfectly correlated with expectations for the Fed Funds Rate. Here's a chart of the market's short term Fed rate expectations and 6-month US Treasuries.
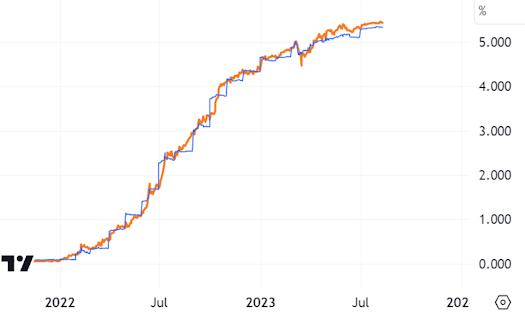
Same chart, same time frame, but 6 month Treasuries are replaced with 10yr Treasuries:

The phenomenon here is that shorter-term rates have had to go much higher due to the Fed's aggressive rate hike campaign, but longer term rates "believe" the Fed will succeed in lowering inflation and crimping economic growth. Longer term rates believed that shorter term rates would eventually come back down such that the average over 10 years would be much lower than current short term rates.
But now that the Fed is talking about holding its policy rate steady, we are no longer seeing as much of an adjustment in short term rates. Instead, the adjustments that arise due to economic data and other motivations are playing out in longer-term rates. This doesn't mean short-term bonds like 2yr Treasuries aren't moving. They just aren't moving as much as the 10yr and they're less willing to spike to higher levels.

Looked at another way, the Fed's unlikely plan of engineering a "soft landing" for the economy by hiking rates abruptly enough to defeat inflation, but not as abruptly as seen in the 1980s (in order to avoid the associated economic pain) appears to be working. To whatever extent that continues to be the case, longer-term rates must continue to adjust for a comparatively better economic outlook than they'd been expecting. They are also adjusting for the reality of lower revenues and higher debt issuance from the Federal government--a supply/demand scenario that has certainly added to upward pressure on rates recently (and potentially exacerbated by new of additional spending needs related to Ukraine and the wildfires in Hawaii).
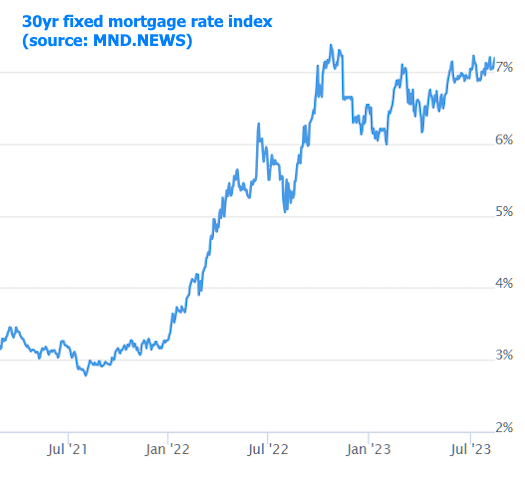
Last but not least, in case it needs to be clarified, mortgage rates fall into the "longer-term" category and have been walking a similar path to longer-term Treasuries--albeit at higher outright levels.
This is the new and persistent reality until one of 3 things happens:
- Annual core inflation makes it back near 2%
- The economy starts showing more serious signs of stress (or actual signs of recession)
- Something completely unprecedented and unexpected results in the U.S. government taking in higher revenue and spending less money
