
Areas deemed as having homes that were less affordable than their historic norms rose by 7 percentage points from the first quarter of 2015 to the first quarter of 2016 according to RealtyTrac. The company analyzed housing and income data for 456 counties nationwide and found that in 43 counties, 9 percent, buying a home was less affordable than the historically normal level for that county going back to the first quarter of 2005. In the first quarter of 2015 only 10 counties or 2 percent fell into that category.
RealtyTrac defines affordability as the percentage of average wages needed to make monthly house payments on a median priced home in an area given a 3 percent down payment and the current 30-year fixed rate mortgage. The calculation does not include property taxes or insurance.
At the peak of the housing bubble in Q2 2006, 454 of the counties analyzed (more than 99 percent) were less affordable than their historic norms. In Q1 2012, when median home prices bottomed out nationally, only two counties out of the 456 (less than one-half percent) exceeded those levels.
"While the vast majority of housing markets are still affordable by their own historic standards, home prices are floating out of reach for average wage earners in a growing number of U.S. housing markets," said Daren Blomquist, senior vice president at RealtyTrac. "The recent drop in interest rates has helped to soften the blow of high-flying price appreciation in some markets, but the affordability equation could change quickly if interest rates trend higher and home prices continue to rise faster than wages."
By historic norms the least affordable housing markets were counties that included the metropolitan areas of Denver, New York City, Omaha, Austin, San Francisco, and St. Louis. The most historically affordable markets included Boston; Baltimore; Birmingham, Providence, and Chicago.
When home prices were most affordable nationwide in Q1 2012, the average wage earner needed to spend 22.2 percent of monthly wages to buy a median-priced home. When home prices were least affordable nationwide in Q2 2006, the average wage earner needed to spend 53.2 percent of monthly wages to buy a median priced home.
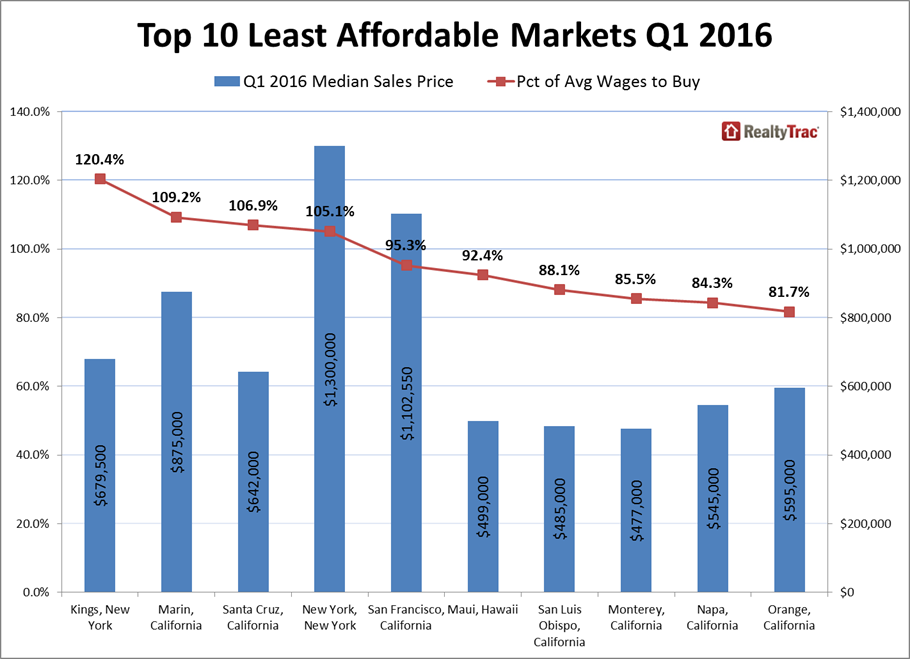
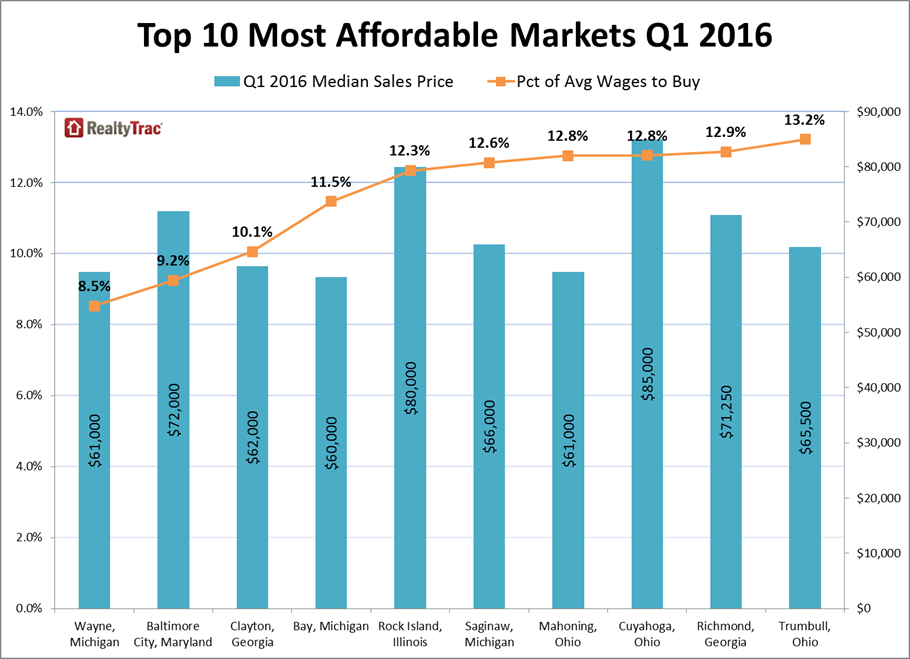
The top five least affordable counties based on percentage of average wages required to buy a median priced home were Kings County, New York (Brooklyn) at 120.4 percent; three California counties, Marin (109.2 percent) Santa Cruz (106.9 percent), and San Francisco (95.3 percent.) New York County (Manhattan), number four at 105.1 percent. On the affordable end of the spectrum the required percentage of income was strikingly different - 8.5 percent in Detroit, 9.2 percent in Baltimore, and 10.1 percent in Clayton County Georgia near Atlanta.
The affordability issue may get worse. RealtyTrac found that median home prices increased faster than wages in 2015 in 276 of the 456 counties analyzed or 61 percent. The top five most-populated county housing markets where price growth outpaced wage growth were Los Angeles (5 percent median home price growth and 3 percent average wage growth); Maricopa County, (Phoenix) (8 percent vs 2 percent); San Diego (5 percent vs 4 percent); and Orange County, California (5 percent vs 2 percent).

In 180 counties wages increases outpaced home price gains. Most notable of these markets were Harris County (Houston) where both wage growth and home price growth were virtually unchanged from a year ago); Queens County, New York; Wayne County (Detroit) New York County, (Manhattan) and Middlesex County (Boston).
