
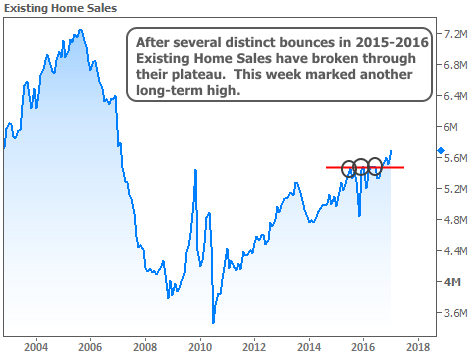
Given an ongoing plateau in home sales figures in 2015-2016, many housing economists thought the late 2016 rate spike would cement a slow-down for the housing market. Although purchase applications definitely took a hit at first, sales metrics have come roaring back.
Nowhere has this been more apparent than in Existing Home Sales, which hit another near-decade-long high this week. Granted, we haven't returned to 2004-2006 levels, but some would say that's a good thing as the current annual pace of 5.69 mln homes is more sustainable.
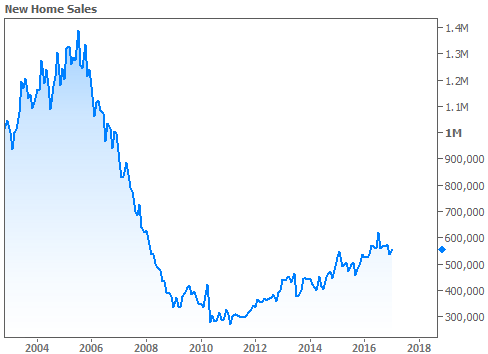
New Home Sales haven't hit new highs for several months, but the positive trend remains very much intact. They improved this week to an annual pace of 555k vs 535k previously.
Perhaps just as heartening (or disheartening, depending on your position) is the current level of price appreciation seen in home sales figures as well as dedicated home price reports. Median prices in January rose 7.1 percent for existing homes and 7.4 percent for New Homes. In separate data, the FHFA (which oversees Fannie and Freddie) reported a 6.2 percent annual rate of appreciation at the end of 2016, citing tight inventory as a key factor.
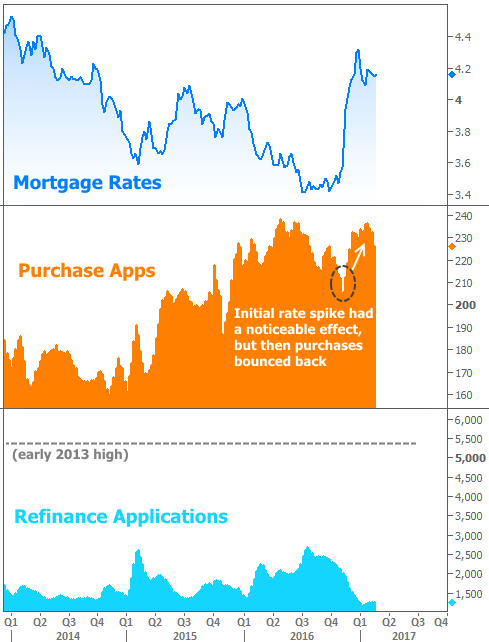
Forward-Looking indicators suggest the sales trends should remain in pretty good shape. While the Mortgage Bankers Association reported a decline in applications this week, purchase apps are still in pretty strong territory relative to the recent post-rate-spike lows. Refi applications have already taken the brunt of their expected damage and continue bouncing along their typical long-term lows.
If the resilience in housing metrics wasn't encouraging enough, this week also saw emerging resilience in interest rates--a phenomenon made all the more interesting by the fact that rates have diverged from other indicators like stocks. In the post-election time-frame, rates and stocks had generally been moving together until this month.
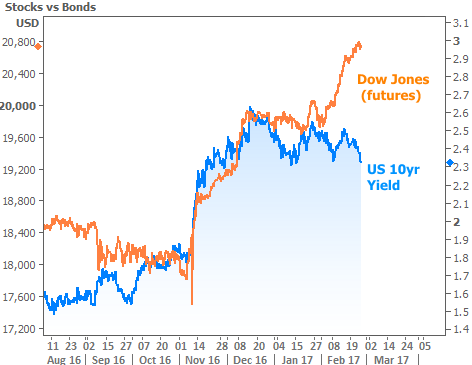
While it's tempting to chalk this divergence up to "earnings season" (something that occasionally accounts for stocks marching to their own beat), we have just as much evidence of rates marching to their own beat. Case in point, 10yr yields (a good proxy for mortgage rate momentum) have broken away from their strong correlation with Fed rate hike expectations.

What does this mean for you? Quite simply, rates are in a consolidation pattern. The highs are getting lower and the lows are holding steady. Such patterns are not uncommon after the sort of rate spike seen at the end of 2016. We'll explore the historical implications of a breakout as soon as it happens, but until then, it makes more sense to expect rates to bounce when they approach recent highs or lows.

Next week brings a hefty slate of scheduled economic data and potential market-movers. Note that the big jobs report is postponed from its typical "first Friday of the month" time slot and will instead be out on Friday March 10th.
